


 Hassan Maishera

TL;DR
-
Ethereum is trading between $1,850 and $1,930 as buyers and sellers battle around key moving averages.
-
US spot Ethereum ETFs have attracted $18.39 million in inflows this week, putting ETH on track for a fourth consecutive week of positive flows.
-
Escalating US-Iran tensions and higher oil prices are weighing on investor sentiment by increasing inflation and Federal Reserve policy risks.
Ethereum (ETH) traded within a narrow range on Friday, with bulls and bears battling for control between key technical levels as improving institutional demand competed against rising geopolitical uncertainty.
At the time of writing, ETH hovered around $1,907, holding above short-term support while struggling to overcome nearby resistance.
Ethereum ETF Inflows Point to Steady Institutional Demand
Institutional interest in Ethereum remains constructive despite broader market uncertainty.
According to SoSoValue, U.S. spot Ethereum exchange-traded funds (ETFs) recorded $18.39 million in net inflows through Thursday. If Friday also closes with positive flows, Ethereum ETFs will register a fourth consecutive week of net inflows.
The sustained inflows suggest institutional investors continue accumulating ETH despite heightened macroeconomic and geopolitical risks, providing an underlying source of support for the cryptocurrency.
While ETF demand has improved, broader market sentiment remains cautious as escalating tensions between the United States and Iran continue to fuel concerns over inflation and global economic stability.
The latest developments include renewed U.S. military strikes against Iranian targets following missile attacks on American forces in the region.
Meanwhile, Iran rejected Oman's proposal for joint management of the Strait of Hormuz, one of the world's most strategically important energy shipping routes.
Separately, Saudi Arabia is reportedly building an international coalition to safeguard shipping lanes through the Bab el-Mandeb Strait, the Red Sea, and the Gulf of Aden following repeated attacks by Yemen's Houthi forces.
These developments have supported crude oil prices amid fears of supply disruptions, raising concerns that higher energy costs could reignite inflation. Investors worry persistent inflation could encourage the Federal Reserve to maintain a restrictive monetary policy, reducing demand for higher-risk assets such as cryptocurrencies.
Ethereum Technical Outlook: Bulls Defend Key Support
On the weekly chart, Ethereum has extended its recovery after breaking above a long-term descending channel in mid-July, although the broader trend remains cautious as the asset still trades below its major long-term Simple Moving Averages (SMAs).
Momentum indicators suggest bearish pressure is gradually fading.
The Relative Strength Index (RSI) has climbed to around 42, approaching the neutral 50 level and signaling improving momentum.
Meanwhile, the Moving Average Convergence Divergence (MACD) continues to hold a bullish crossover established in early July, reinforcing the medium-term recovery outlook.
If buying momentum strengthens, Ethereum could target the 200-week SMA near $2,481.
However, failure to sustain the recent recovery could expose ETH to a decline toward the major support area around $1,511.
On the daily timeframe, Ethereum remains trapped between two important moving averages.
The cryptocurrency continues to trade above the 50-day Exponential Moving Average (EMA) near $1,850, indicating that buyers are defending short-term support.
However, the 100-day EMA around $1,933 continues to cap upside momentum, preventing a stronger recovery.
The daily RSI remains near 55, reflecting modest bullish momentum, while the MACD histogram remains below zero, suggesting downside risks have not fully disappeared.
If the rally resumes, ETH will look to surge past the 100-day EMA at $1,933, with another hurdle at the $2,000 psychological mark. A daily candle close above this level could expose the 200-day EMA at $2,159.
However, if the bearish trend persists, ETH will likely test the support at $1,850 (50-day EMA), with another demand zone at $1,511.
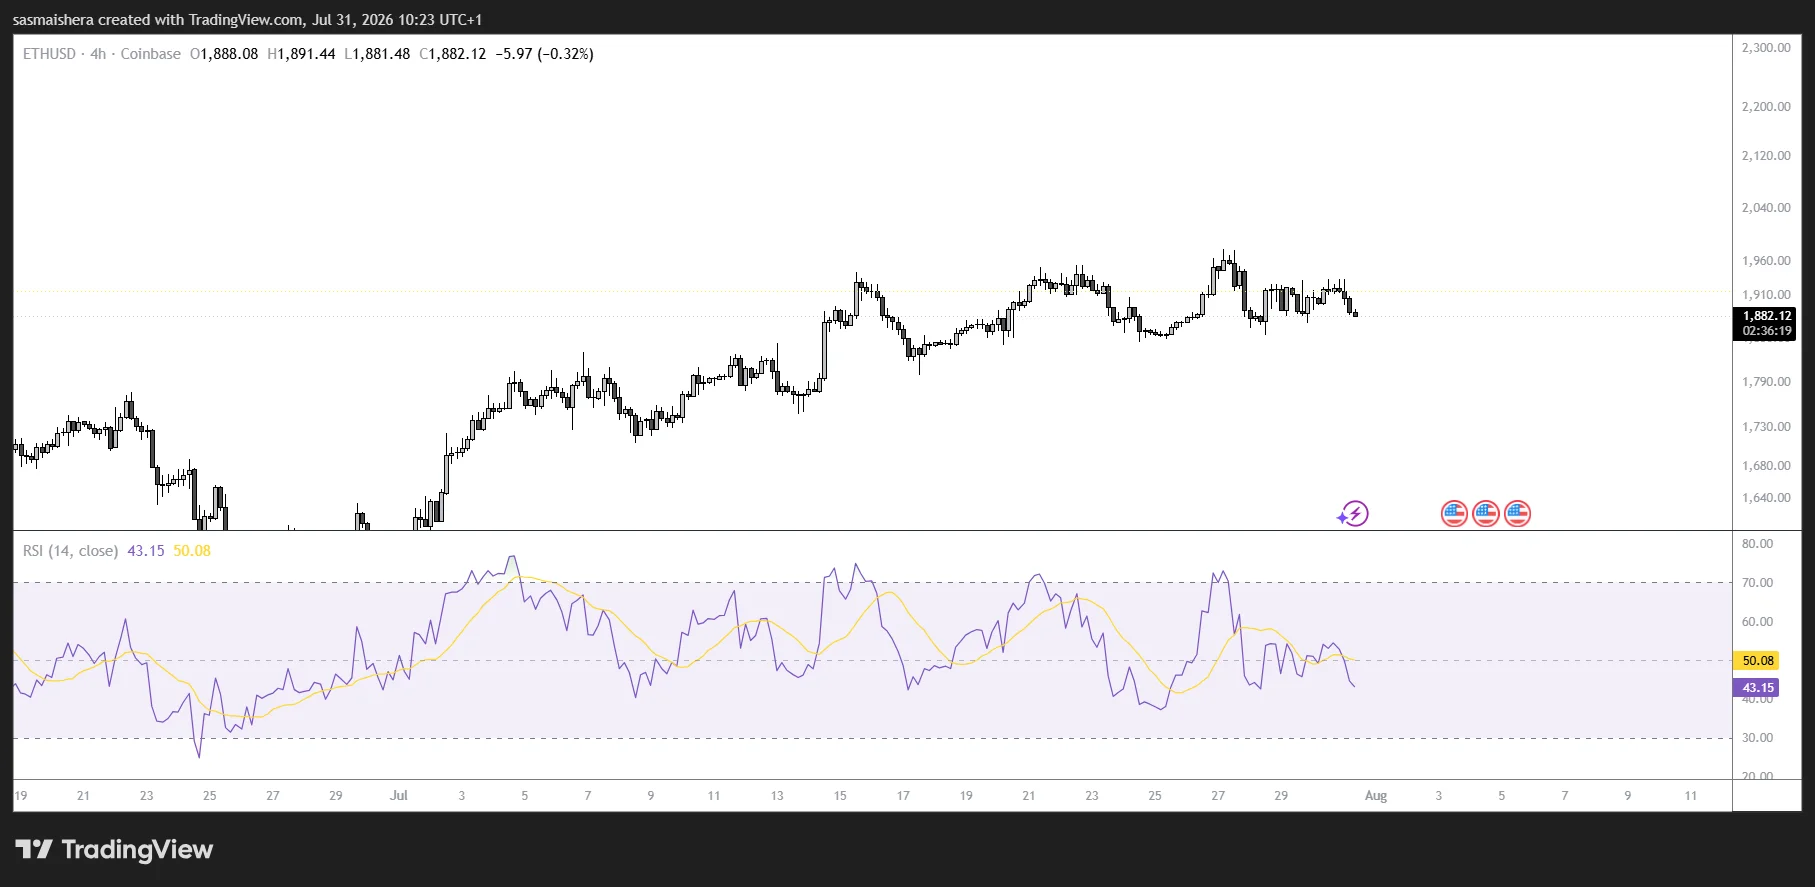
A decisive close below these levels could see ETH test $1,385, a critical horizontal support that, if broken, would significantly weaken Ethereum's medium-term structure.
For now, Ethereum remains in a consolidation phase, with continued ETF inflows providing support while geopolitical uncertainty limits bullish momentum. A decisive move above $1,933 would strengthen the recovery outlook, whereas a break below $1,850 could invite renewed selling pressure.