


 Hassan Maishera

TL;DR
-
Hyperliquid (HYPE) is trading below $54.80 after falling more than 8% this week.
-
US-listed spot HYPE ETFs recorded $1.24 million in net outflows on Tuesday, marking four consecutive days of withdrawals.
-
Derivatives data shows bearish sentiment, with the long-to-short ratio falling to 0.95.
-
HYPE remains below its 100-day EMA, while the MACD and RSI continue to signal weakening momentum.
Hyperliquid (HYPE) continues to trade under pressure on Wednesday, slipping below $54.80 after declining more than 8% so far this week. Weakening institutional interest and increasingly bearish technical signals suggest the token could face additional downside in the near term.
Institutional demand for HYPE has weakened in recent trading sessions. According to CoinGlass’s ETF page, US-listed spot HYPE exchange-traded funds (ETFs) recorded $1.20 million in net outflows on Tuesday, extending their withdrawal streak to four consecutive trading days.
Continued ETF outflows could further dampen investor sentiment and increase selling pressure if institutional investors continue reducing exposure throughout the week.
Futures market positioning also points to a more cautious outlook. Data from CoinGlass shows Hyperliquid's long-to-short ratio stood at 0.95 on Wednesday, hovering near its lowest level in more than a month.
A ratio below 1.0 indicates that more traders are opening short positions than long positions, reflecting growing expectations of further price declines.
Hyperliquid Technical Outlook: Bears Target Key Support Near $50
From a technical perspective, Hyperliquid remains in a fragile position. The token is currently trading above its 200-day Exponential Moving Average (EMA) at $50.80, but remains below the 100-day EMA at $57.26, indicating that the broader trend continues to favor sellers.
The Relative Strength Index (RSI) is hovering around 35, suggesting bearish momentum remains dominant despite approaching oversold territory.
Meanwhile, the Moving Average Convergence Divergence (MACD) indicator remains below its signal line and in negative territory, reinforcing the view that any short-term rallies may encounter selling pressure.
If buyers regain control, the first major resistance lies between $57.30 and $57.40, where the 100-day EMA aligns with the 50% Fibonacci retracement level.
A sustained move above that area could pave the way toward the 50-day EMA at $61.28, followed by the 38.2% Fibonacci retracement near $65.07.
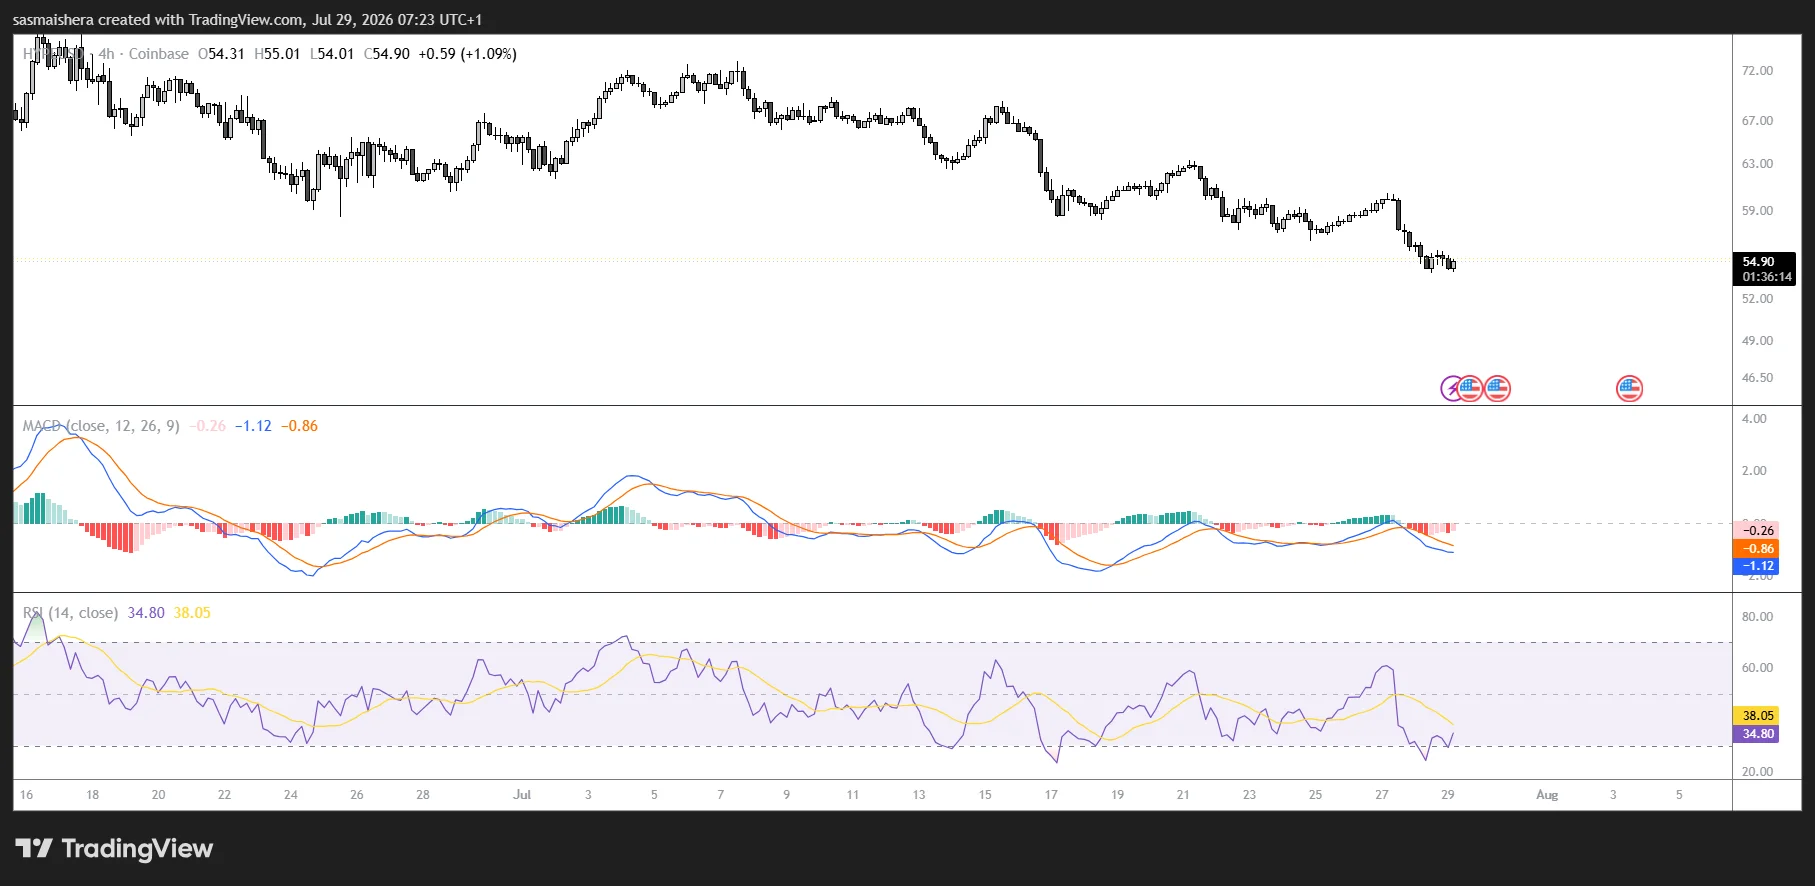
On the downside, immediate support is located at the 200-day EMA around $50.80, followed by the 61.8% Fibonacci retracement at $49.75.
A decisive break below this support zone could accelerate selling pressure and expose the next downside targets at $38.85 and $24.96, where stronger buying interest could emerge.