


 Hassan Maishera

TL;DR
-
Quant traded around $280 on Monday after rising nearly 350% last week.
-
The rally followed news of a deal involving The Clearing House and tokenized deposit settlement.
-
QNT futures open interest reached a reported record $158.80 million, showing a sharp rise in leveraged positions.
-
A negative funding rate and an overbought weekly RSI point to risks after the rapid advance.
-
Traders are watching support near $250 and resistance at last week’s $373 high.
Quant (QNT) held above $250 on Monday after a steep rally tied to news that it would support tokenized deposit settlement through a deal with The Clearing House.
The token traded around $280 after gaining nearly 350% last week. The reported arrangement would position Quant as a transaction layer for clearing and settling tokenized deposits across 25 major U.S. banks, according to FXStreet.
Futures Activity Surges Alongside QNT Price
QNT futures open interest rose to a reported record $158.80 million as traders built positions during the rally. Open interest measures outstanding derivatives contracts; its increase shows greater participation, though it does not reveal whether those positions will support further gains.
The funding rate turned negative at −0.0136%. That suggests a slight tilt toward short positions in the measured futures market, even as QNT remained well above its price before last week’s surge.
Weekly Indicators Show Strength and Overheating
At approximately $280, QNT stood far above its 50-week, 100-week and 200-week exponential moving averages (EMAs), reported at $87.78, $88.89 and $102.44, respectively. The 50-week EMA had also crossed above the 200-week EMA, a pattern commonly viewed as a longer-term bullish signal.
Momentum readings were strong. The weekly moving average convergence divergence indicator continued to rise, while the relative strength index reached 80. An RSI at that level indicates an overbought market and raises the possibility of a pullback or a period of consolidation.
The $250 area is the nearest level to watch as QNT settles after last week’s jump. Below it, the analysis identifies former highs around $228 and $171.70 as potential support.
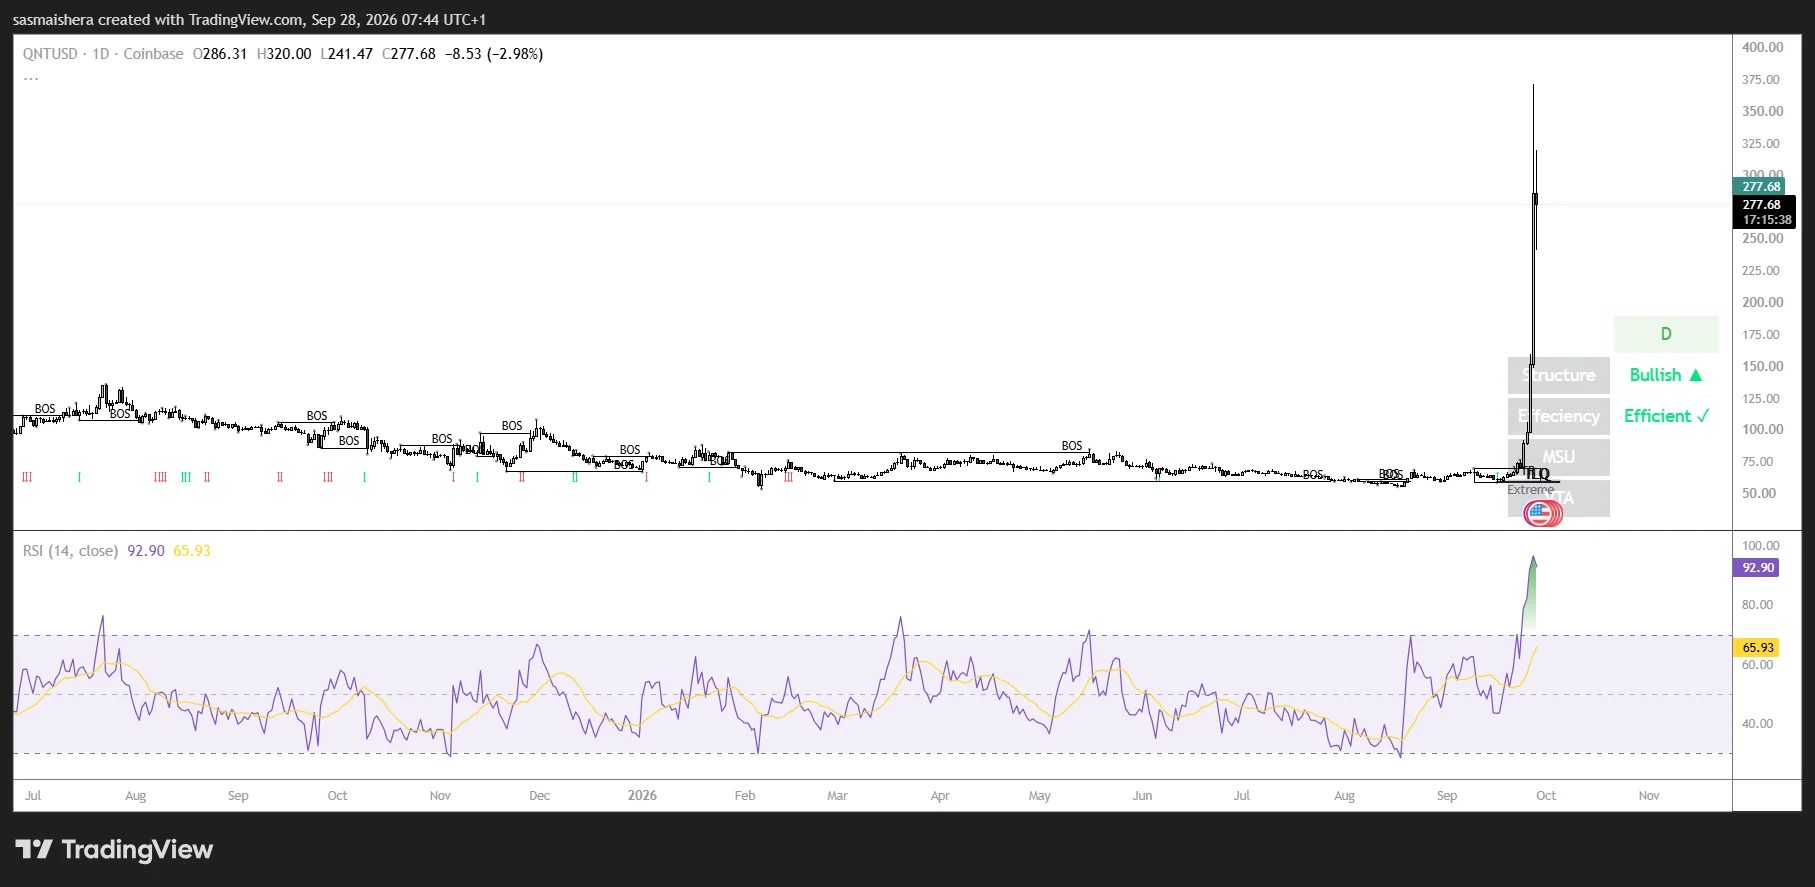
For the rally to extend, QNT would first need to reclaim last week’s high near $373. Its record high around $430 would then be the next major test. A move toward higher projected targets would depend on a sustained breakout, especially given the scale of the recent advance.