A Guide to Technical Analysis and Chart Interpretations
In the intricate world of investing, deciphering market patterns is pivotal. Technical analysis serves as a compass, revealing insights into market trends and potential future movements. This guide, rooted in our extensive experience, is designed to demystify technical analysis and chart interpretations, complete with practical examples and a focus on expertise, authoritativeness, and trustworthiness. Technical analysis is built on the foundation of interpreting charts, a skill crucial for making informed trading decisions. Here's an actionable and detailed look at the key elements of chart analysis:
Basic Charts
-
Types of Charts: Line charts, bar charts, and candlestick charts are the primary tools for technical analysts. Each type offers unique insights. For instance, a line chart is excellent for identifying general trends, while a bar chart provides more detailed information about opening and closing prices.
-
Candlestick Charts: Candlestick charts are particularly informative, displaying detailed information about price movements within a specific period. They show open, high, low, and close prices, making them invaluable for spotting trends and reversals. For example, a long candlestick with a small wick indicates strong buying or selling pressure.
Candlestick Patterns
-
Pattern Recognition: Recognizing candlestick patterns is key to understanding market sentiment. For instance, a 'Bullish Engulfing' pattern suggests a potential upward trend, while a 'Bearish Harami' can signal a downward turn.
Moving Averages
-
Types of Moving Averages: The Simple Moving Average (SMA) offers a clear view of the trend over a specified period, while the Exponential Moving Average (EMA) gives more weight to recent prices, making it more responsive to new information.
For instance, a rising 50-day SMA might indicate a strong uptrend, suggesting a good buying opportunity. Conversely, a falling 200-day SMA could signal a long-term downtrend, hinting at a selling or short-selling opportunity.
Support and Resistance
-
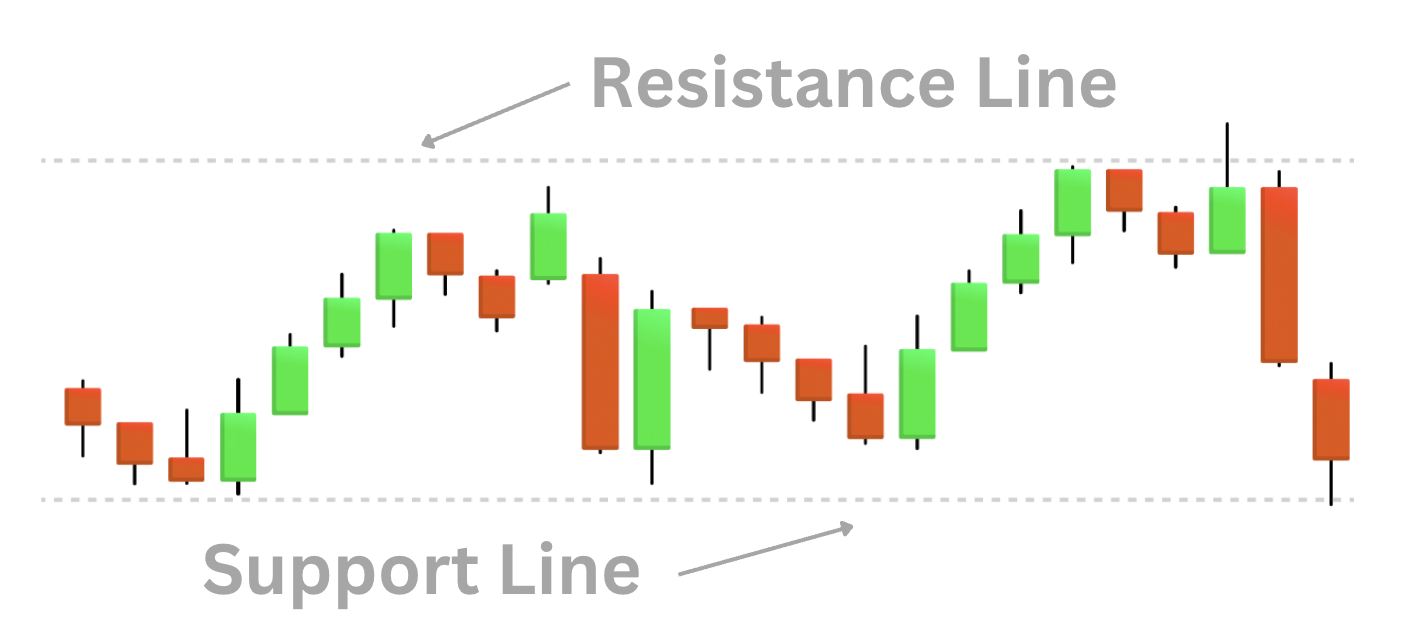
Importance: Support and resistance levels are where trends often pause or reverse, acting as critical thresholds for price movements.
Traders use these levels to plan entry and exit points. For example, buying near support levels in an uptrend or selling near resistance levels in a downtrend can optimize trade outcomes.
Volume Analysis
-
Role of Volume: Volume analysis helps validate the strength of a trend. For instance, an upward price movement on high volume is generally seen as a stronger bullish signal than a similar move on low volume.
A surge in volume alongside a breakout from a resistance level can be a strong buy signal, indicating robust market support for the upward trend.
Technical Indicators
-
Key Indicators: Indicators like RSI, MACD, and Bollinger Bands are essential for identifying market conditions. The RSI indicates overbought or oversold conditions, MACD shows momentum and trend changes, and Bollinger Bands measure market volatility.
Advantages and Limitations of Technical Analysis and Chart Interpretations
Technical analysis, a methodology for forecasting the direction of prices through the study of past market data, offers unique insights into trading but comes with its own set of limitations.
Advantages of Technical Analysis:
-
Objective Data Utilization: Technical analysis is grounded in concrete, objective data such as price and volume. This reliance on quantifiable information removes much of the subjectivity associated with other forms of analysis.
-
Market Universality: It is versatile and applicable across various markets and instruments, including stocks, bonds, commodities, and cryptocurrencies. This universality makes it a valuable tool for diverse investment portfolios.
-
Pattern and Trend Identification: Technical analysis excels in identifying market patterns and trends, such as uptrends, downtrends, and sideways movements. Recognizing these patterns helps in making informed predictions about future market behavior.
-
Risk Management: By identifying key levels of support and resistance, technical analysis aids in setting strategic stop-loss orders, thereby helping manage and mitigate risk.
Limitations of Technical Analysis:
-
Historical Focus: Technical analysis primarily relies on historical price and volume data. This backward-looking focus means it does not predict future market movements with absolute certainty.
-
Exclusion of Fundamental Factors: It often overlooks fundamental aspects like company financials, management quality, and industry trends, which can have a significant impact on a security's performance.
-
Potential for Information Overload: With a plethora of indicators and chart patterns available, there's a risk of information overload. This abundance of data can lead to confusion and conflicting interpretations.
-
Subjective Interpretation: Despite its basis in objective data, the interpretation of chart patterns and indicators can be subjective. Different analysts might draw different conclusions from the same data set, leading to varied investment decisions.
Conclusion: Practical Implications of Candlestick Patterns and RSI Indicators
After exploring the various tools and strategies of technical analysis, we arrive at a practical example that brings our learnings to fruition. The chart provided offers a clear depiction of a bullish engulfing candlestick pattern, a powerful signal in the technical analyst's repertoire. This pattern emerges when a larger green candle follows and completely covers the range of a preceding smaller red candle. It indicates a strong buying pressure that has overcome the selling pressure, suggesting a potential trend reversal.
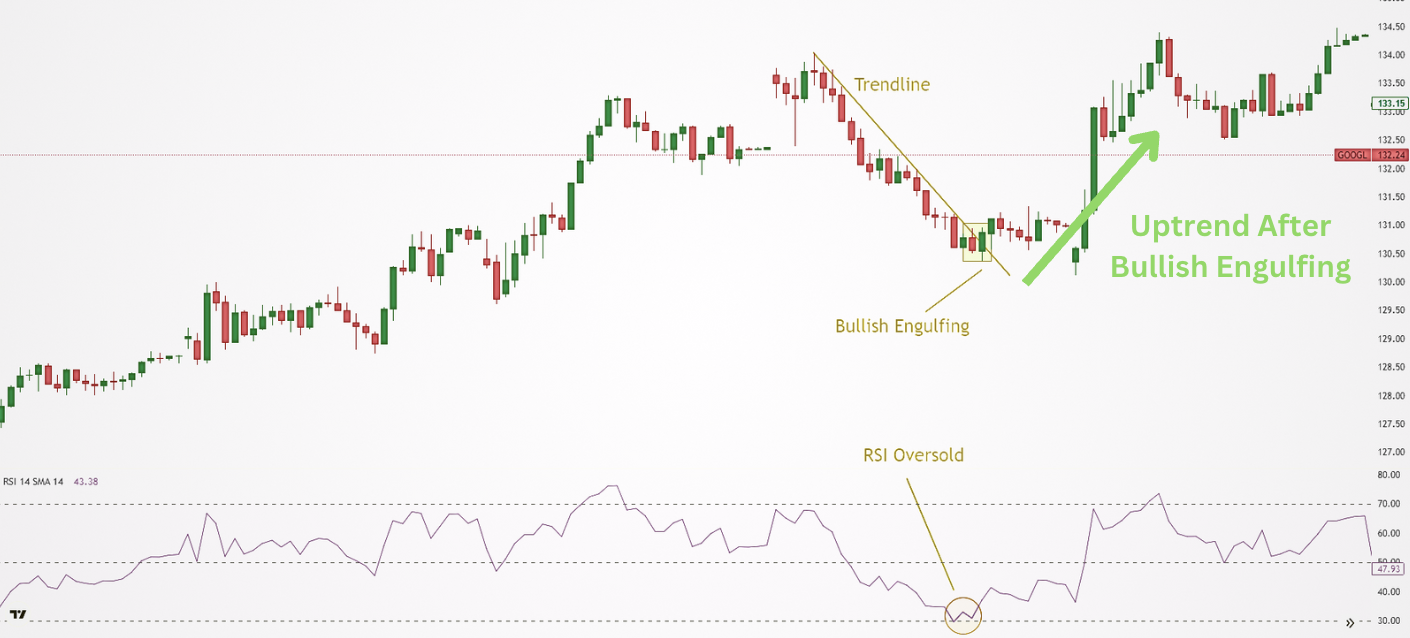
This reversal signal is further reinforced by the RSI, which has dipped into the 'oversold' territory below 30. Such an extreme reading often suggests that the asset may be due for a rebound as the selling momentum has potentially exhausted itself.
The ensuing uptrend, as shown in the chart, validates the bullish engulfing pattern's predictive capability when combined with the RSI reading. The break above the trendline, which previously acted as resistance, further confirms the shift in market sentiment from bearish to bullish.
In conclusion, this practical example underscores the effectiveness of using candlestick patterns alongside momentum indicators like the RSI to identify potential entry points and forecast market trends. It exemplifies the actionable insights that can be derived from a nuanced understanding of technical analysis and chart interpretation.
Comments
Log in to post a comment
No comments yet
Be the first to share your thoughts!