


 Hassan Maishera

TL;DR
-
Litecoin climbed above $68 to its highest level in eight months, extending its monthly gain to approximately 40%.
-
Grayscale filed an amended S-3 registration statement seeking to convert its Litecoin Trust into a spot LTC ETF.
-
Canary Capital’s listed Litecoin ETF has recorded about $402,140 in monthly inflows after approximately $239,030 in outflows during August.
-
LTC could target $72.64 and $84.89, but an RSI reading of 80 warns that the rally is overbought and vulnerable to a correction.
Litecoin (LTC) extended its recovery on Thursday, trading above $68 and reaching its highest price in eight months despite a broader cryptocurrency sell-off linked to interest-rate concerns.
The token was trading around $68.47 after gaining approximately 40% since the beginning of the month. Its recovery from the June 25 low of $39.28 has placed LTC firmly above its major moving averages and returned several higher resistance levels to focus.
Institutional developments involving Litecoin exchange-traded funds have supported the rally, while activity in the derivatives market has increased sharply. However, mixed liquidation data and an overbought momentum reading suggest that the advance may be entering a more volatile phase.
Grayscale Filing Supports Litecoin’s Rally
Litecoin’s recovery accelerated after Grayscale filed an amended S-3 registration statement with the US Securities and Exchange Commission.
The asset manager is seeking to convert its existing Litecoin Trust into a spot LTC exchange-traded fund. Such a conversion could make the product more accessible through conventional brokerage accounts and potentially improve liquidity for its investors.
The amended filing does not mean the SEC has approved the conversion. Grayscale must still satisfy the regulator’s requirements and complete the necessary exchange-listing process before the product can operate as an ETF.
Nevertheless, the filing has improved sentiment by increasing expectations that regulated Litecoin investment products could become more widely available in the United States.
Canary Capital’s listed Litecoin ETF has also recorded stronger demand this month. The fund has attracted approximately $402,140 in net inflows after posting around $239,030 in outflows during August, according to SoSoValue data cited in the original report.
The figures remain relatively modest compared with the flows commonly recorded by Bitcoin and Ethereum ETFs. However, the return to positive territory suggests investor interest in regulated LTC exposure is improving.
Continued inflows would provide stronger confirmation that institutional demand is supporting Litecoin’s price recovery. A reversal back into outflows would weaken that part of the bullish narrative.
Litecoin Futures Open Interest Jumps 10%
Retail and derivatives traders have also increased their exposure to Litecoin. CoinGlass data shows that LTC futures open interest climbed 10% over 24 hours to $613.30 million. That represents the largest outstanding futures position since January 19 and an eight-month high.
Open interest measures the value of active futures contracts that have not been closed or settled. An increase alongside rising prices shows that traders are committing additional capital as the market advances.
The metric does not reveal whether those positions are predominantly bullish or bearish because it includes both long and short contracts. It therefore confirms growing participation without providing a conclusive directional signal.
Litecoin’s open-interest-weighted funding rate increased slightly to 0.0032%. A positive rate means traders holding long perpetual futures are paying those with short positions, indicating a mild preference for bullish exposure.
The relatively small reading suggests optimism without the extreme cost sometimes associated with heavily overcrowded long positioning. Still, the sharp increase in total open interest raises the potential for larger liquidations if LTC makes a sudden move.
Litecoin Holds Above Major Moving Averages
Litecoin’s daily chart maintains a clear bullish structure. At $68.47, LTC is trading well above its 50-day exponential moving average at $52.85, its 100-day EMA at $50.97, and its 200-day EMA at $54.04.
The token’s position above all three averages indicates that buyers control the short-, medium-, and longer-term trend. Those indicators also create a broad support zone if the price retreats.
The Moving Average Convergence Divergence indicator remains above its signal line in positive territory. Its continued rise shows that upward momentum has not yet reversed.
The Relative Strength Index offers a more cautious message. Its reading near 80 is well above the conventional overbought threshold of 70.
An overbought RSI does not guarantee that the price will fall immediately, particularly during a strong trend. It does indicate that the rally has become stretched and that new buyers face a less favorable entry point than they did earlier in the recovery.
Litecoin’s first upside target is $72.64, a former support level established by the December 18 low. Because broken support can become resistance, buyers may encounter increased selling around that price.
A confirmed daily close above $72.64 could open a path toward $84.89, the high recorded on January 6. Reaching that level from $68.47 would represent an additional gain of roughly 24%.
A breakout should ideally be accompanied by sustained spot demand rather than relying primarily on leveraged futures positions.
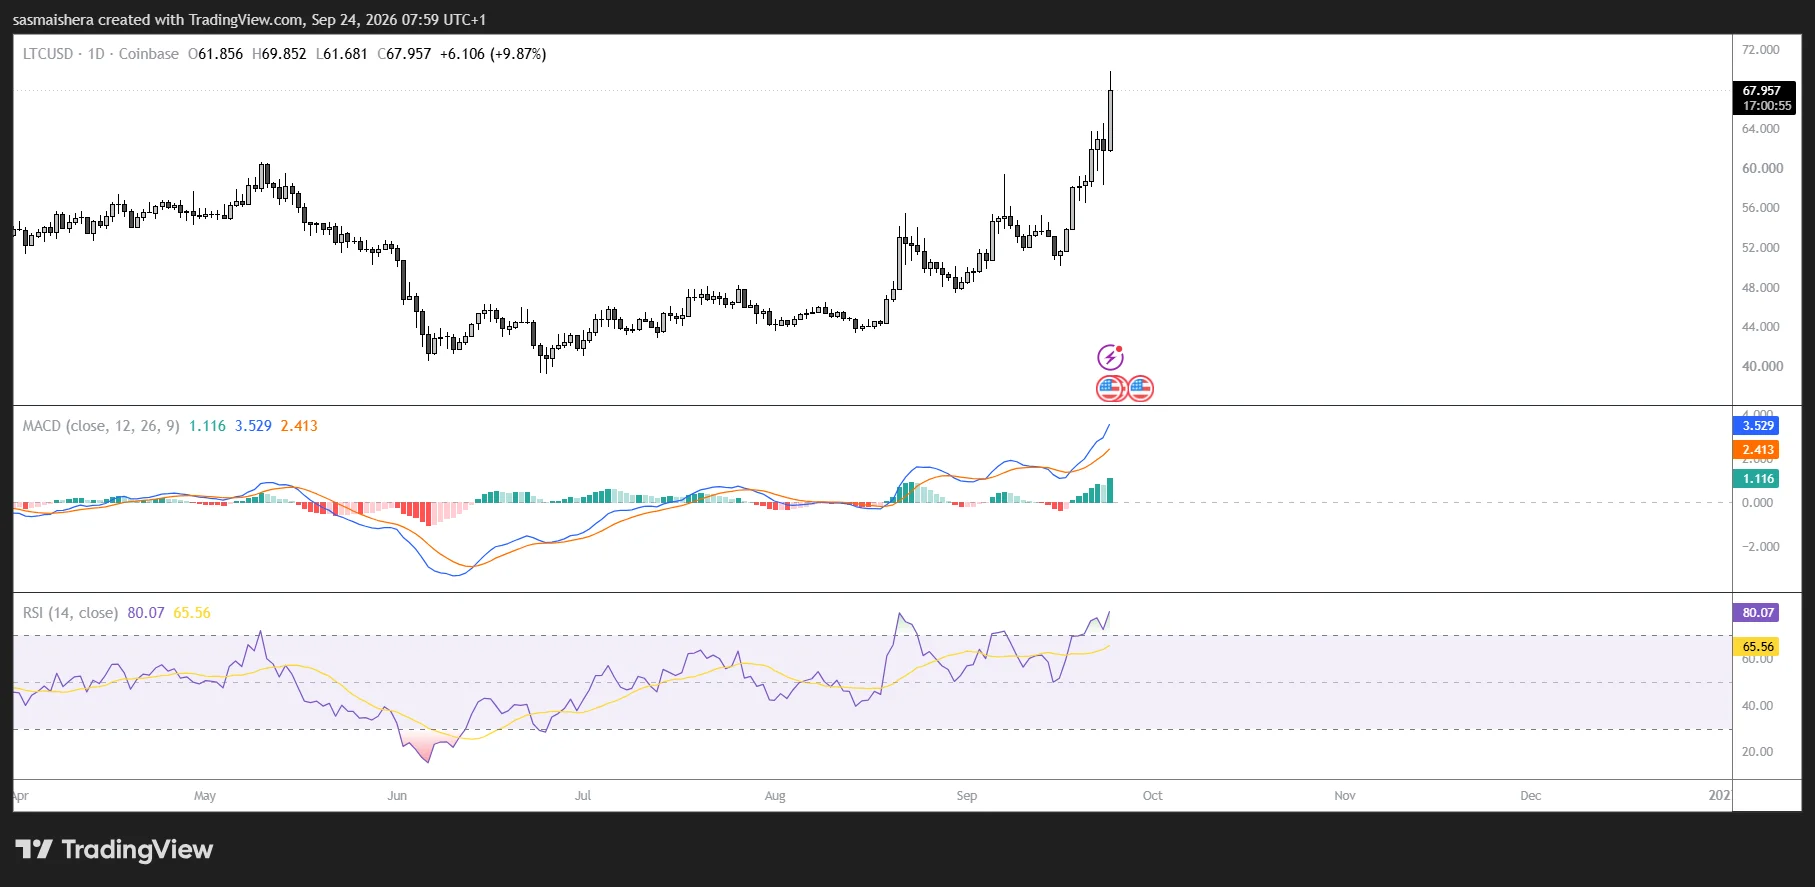
If LTC corrects, its first major dynamic support sits at the 200-day EMA near $54.04. Below that, the 50-day EMA at $52.85 and the 100-day EMA at $50.97 form a dense structural floor.
The distance between the current price and those moving averages shows how rapidly Litecoin has advanced.
For now, ETF optimism, rising open interest, and positive momentum support further upside, but the RSI reading of 80 makes a pullback or consolidation increasingly likely before a sustained move toward $84.89.