Order Flow Analysis in Crypto: Reading the Tape on Decentralized Markets January, 2026
This guide teaches crypto traders how to use order flow analysis to gain an edge in decentralized markets. Learn to read real-time trades, spot hidden moves, and act before the chart shows it.
 Written by Nikolas Sargeant
| Комиссии биржи | Методы внесения депозита | |||||||||
|---|---|---|---|---|---|---|---|---|---|---|
| Названия | Поддерживаемые криптовалюты | Комиссия тейкера | Комиссия мейкера | Комиссии за вывод средств | Банковский перевод | Кредитная карта | Trading API | АКТИВНЫЙ С | Offer | |
|
Bybit
Contract Trading Exchanges
|
188 | 0.06% | 0.01% | 0.0005 | 2018 |
GET UP TO USD 600 IN REWARDS!
|
Посетить | |||
|
Binance
Centralized Exchanges
|
433 | 0.10% | 0.10% | 0.0002 | 2017 |
GET UP TO USD 100 WELCOME BONUS
|
Посетить | |||
|
KuCoin
Centralized Exchanges
|
637 | 0.10% | 0.10% | 0.0005 | 2017 |
GET UP TO 500 USDT IN SIGN-UP BONUS
|
Посетить | |||
|
Coinbase
Centralized Exchanges
|
136 | 2.00% | 2.00% | 0.000079 | 2012 |
GET USD 5 SIGN-UP BONUS!
|
Посетить | |||

Uniswap
Decentralized Exchanges
|
390 | 0.30% | 0.30% | 0.000079 | 2018 |
|
||||
|
SushiSwap Exchange
Decentralized Exchanges
|
79 | 0.30% | 0.30% | 0.00041 | 2020 |
|
||||
If you’ve ever watched Bitcoin surge upward and wondered, “Who’s buying this right now?”, you’ve already begun to think in terms of order flow.
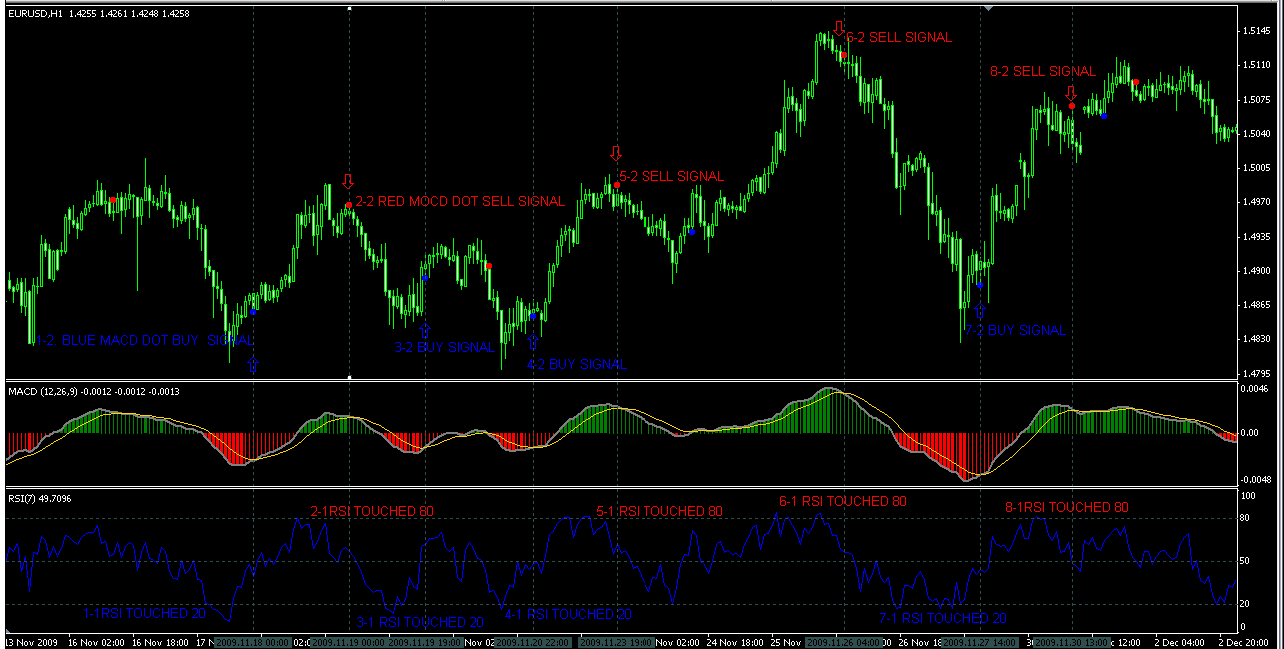
Order flow analysis is about interpreting real-time buy and sell activity to understand what traders are doing beneath the surface. Instead of looking at static candlestick charts or lagging indicators like RSI or MACD, order flow focuses on intent, who’s placing orders, how fast they’re being filled, and how that activity shifts market structure second by second.
In traditional markets, order flow is used by prop traders and institutions to anticipate moves and manage risk. But in crypto, it becomes even more critical. Why? Because crypto markets are more fragmented, operate 24/7, and tend to attract a higher mix of retail traders and bots. This makes price behavior more erratic, and often more revealing.
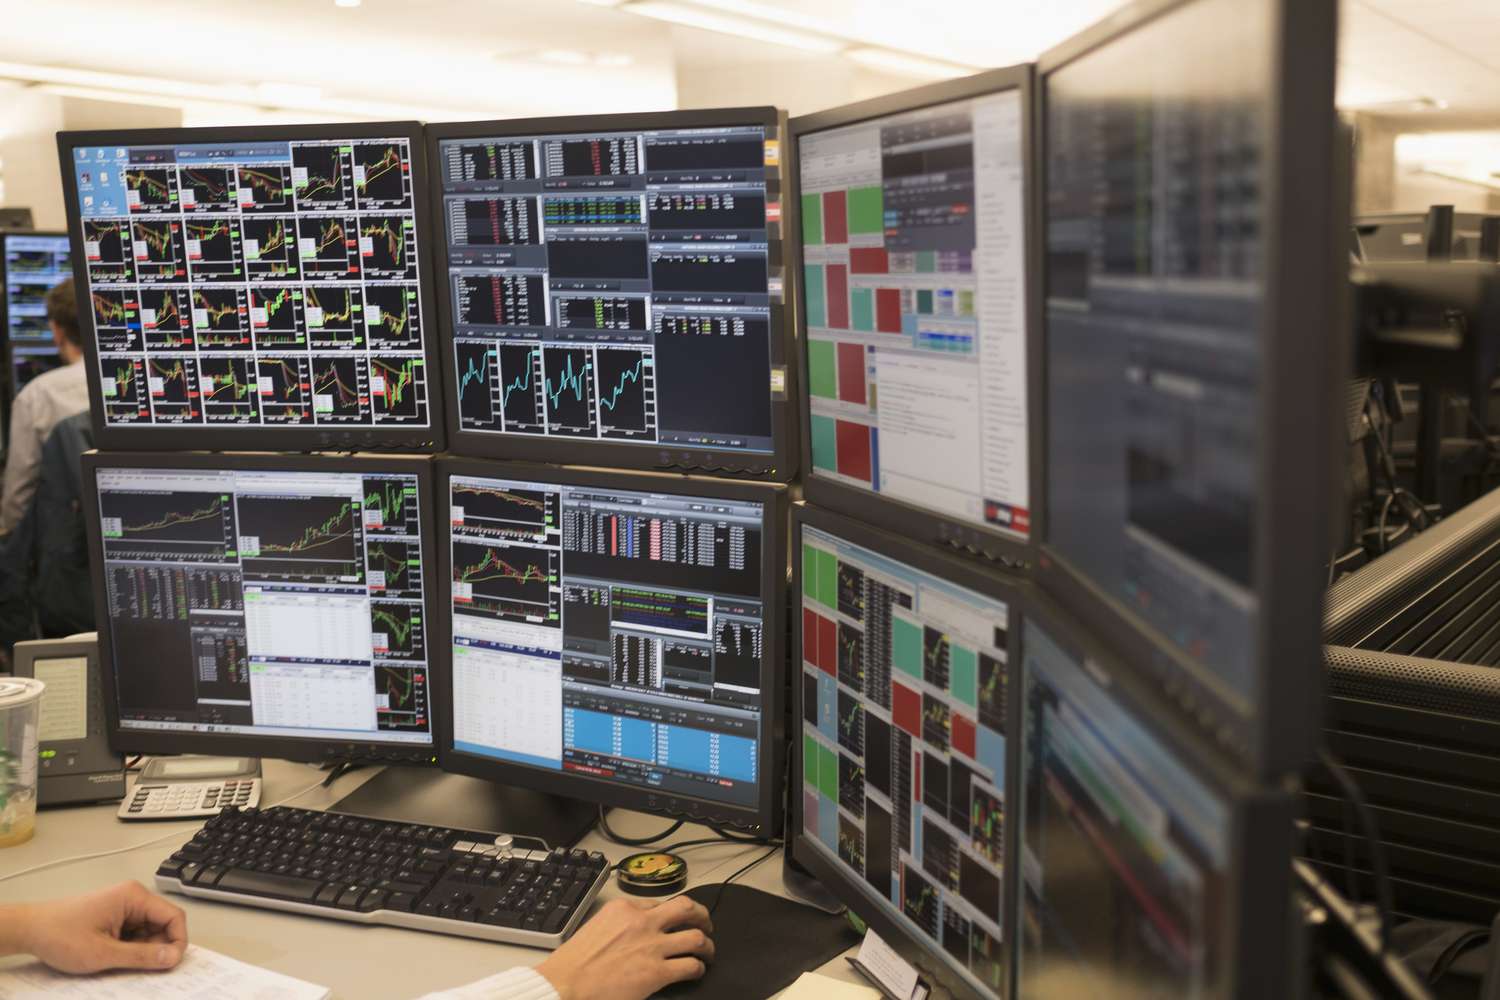
Imagine standing in a crowded room and hearing a sudden hush, something’s changed, and everyone’s attention has shifted. That’s what a trader tuned into order flow sees when a surge of market buys suddenly hits resistance or when a large sell wall is quietly absorbed without price movement. It’s nuance, but it’s incredibly powerful.
This guide will help you see those micro-moments, decode the noise, and start reading the market like a living, breathing organism, not just a sequence of candles.
What Is Order Flow Analysis?
Order flow analysis is the process of tracking and interpreting real-time buy and sell activity to understand what’s driving price movement beneath the surface. While most traders rely on lagging indicators or static chart patterns, order flow helps you see what’s actually happening — in the moment — as market participants react, hesitate, or commit capital.
It revolves around several key components:
- Market Orders — These are executed immediately at the best available price. They represent urgency and aggression — someone wants in or out now. A flurry of market buys often indicates chasing behavior, while a sudden wave of market sells may suggest panic or profit-taking.
- Limit Orders — These rest in the order book, waiting to be filled at a specific price. Large clusters of limit orders can act as support or resistance. Sometimes, however, traders place large orders to influence sentiment — a tactic known as spoofing.
- Trade Tape (Time & Sales) — This is a real-time stream of completed transactions. It shows who’s hitting the market and at what size and speed. Watching the tape helps you recognize when big players are stepping in — especially when they’re trying to do it quietly.
- Order Book Depth — This visualizes the current landscape of bids and asks. It reveals liquidity pockets and imbalances — areas where a lot of orders are stacked up, or where there’s a vacuum that price could slip through quickly.
Together, these tools allow you to read intention, pressure, and imbalance in a way that no candlestick ever could.
Example: Let’s say on Binance, you notice a 250 BTC sell wall at $63,000. Suddenly, market buys start chewing through it in chunks of 10, 15, 20 BTC — and within 30 seconds, the wall is gone. That’s not random noise — it’s a signal. A whale just cleared the path, and momentum is likely about to follow.
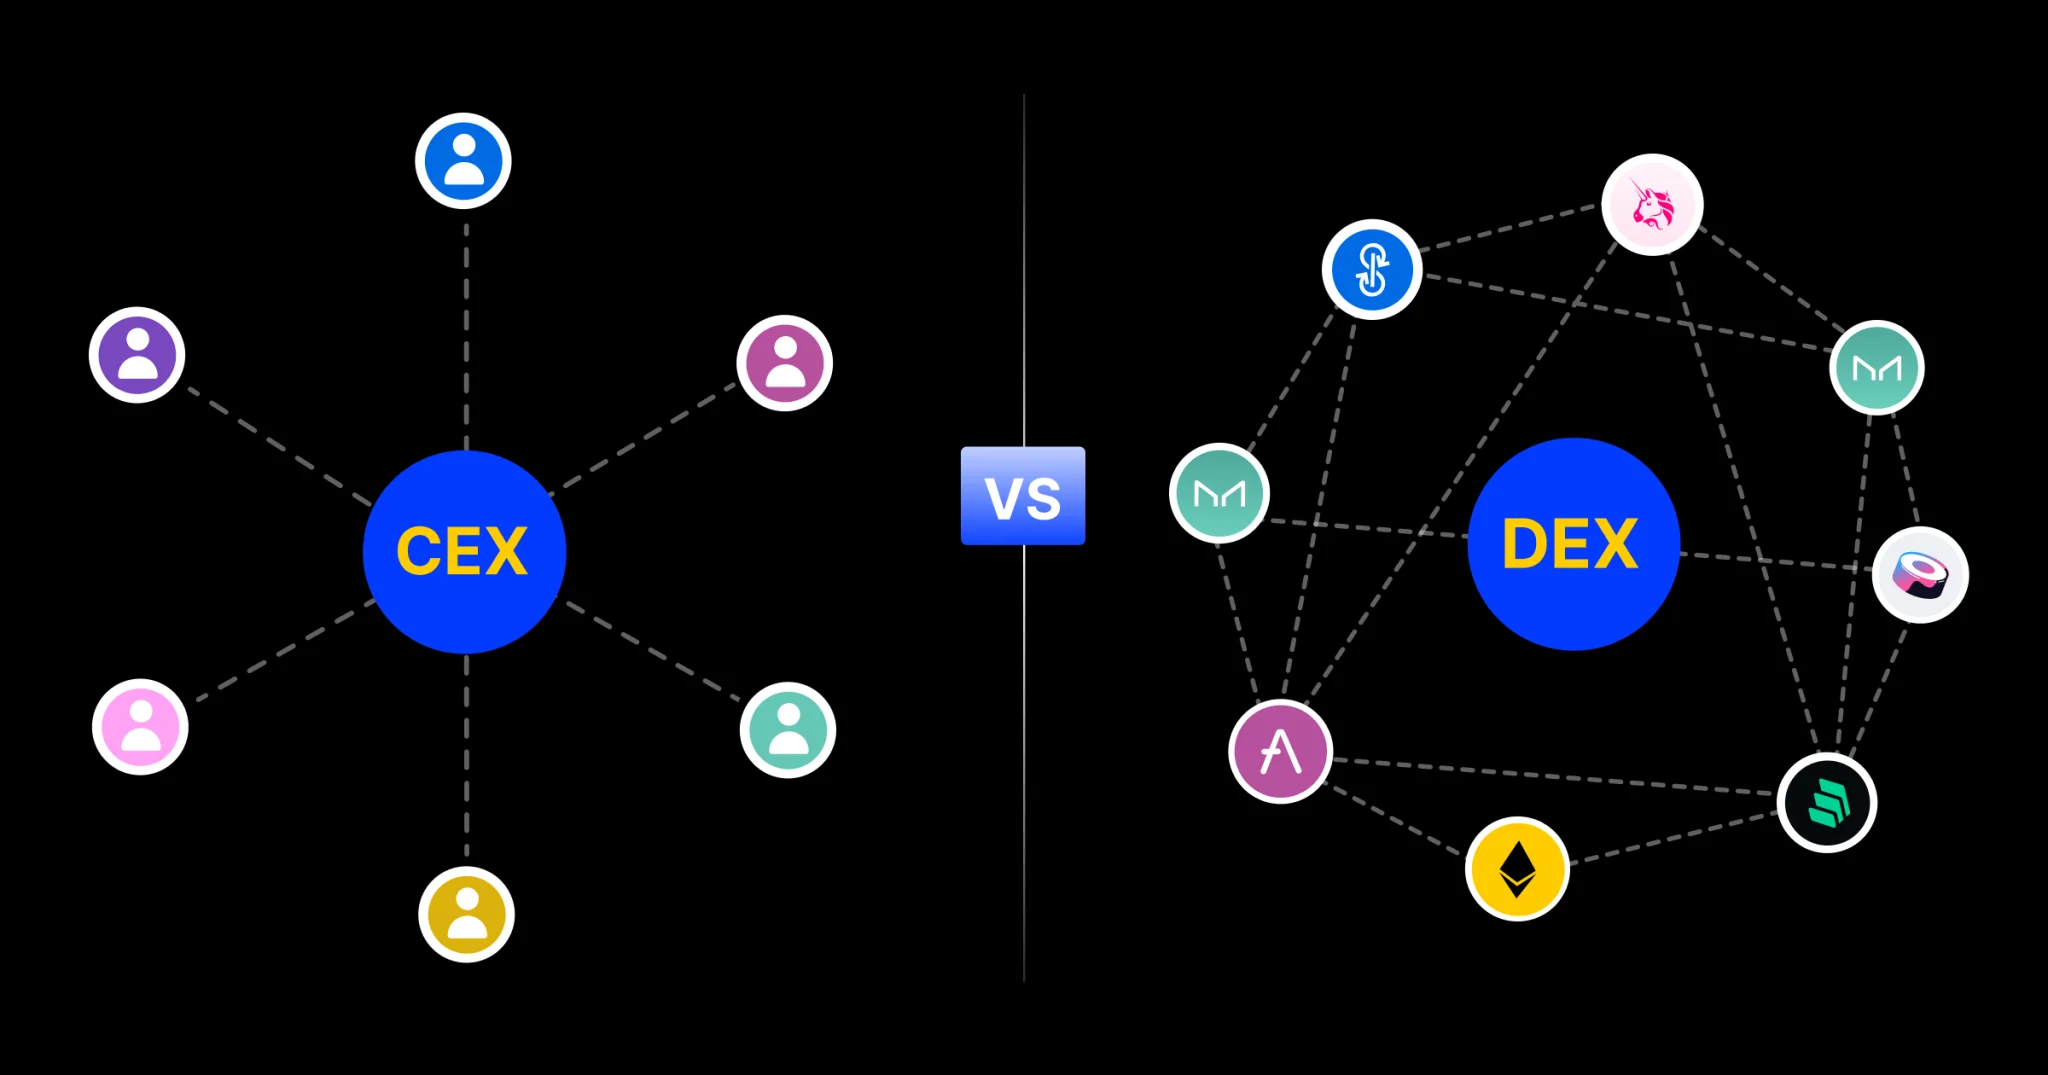
Order Flow in Traditional vs. Decentralized Markets
Order flow analysis has long been a staple in traditional finance — from equities to futures. In those markets, traders often use institutional-grade tools like Level 2 data, depth of market (DOM) panels, and consolidated trade tapes. The environment is structured, the data is standardized, and regulation ensures a level playing field — at least in theory.
Crypto? Not so much.
In centralized crypto exchanges (CEXs) like Binance, Bybit, KuCoin, or Coinbase, order flow tools are available, but with limitations. Each platform has its own architecture, feed delay, and execution quirks. While you can usually see depth charts and time & sales feeds, they’re often aggregated and not always millisecond-accurate. Still, for short-term traders, these tools are invaluable for spotting when market buyers are overpowering resistance, or when limit orders are soaking up pressure unnoticed.
But when you move to decentralized exchanges (DEXs), things change dramatically.
DEXs like Uniswap or SushiSwap don’t operate on an order book model. Instead, they use automated market makers (AMMs), where liquidity is pooled and pricing is dictated by algorithms. There’s no bid-ask spread, no resting limit orders, and no DOM panel to watch.

So how do you analyze order flow in a decentralized world?
You go on-chain.
- You can track wallet behavior directly using explorers like Etherscan or Solscan.
- You can monitor large swap transactions as they’re mined into blocks.
- Some advanced traders even follow MEV bots (Miner Extractable Value) to understand front-running and sandwich trades — a real-time look at how bots manipulate flow on DEXs.
Relatable example: Suppose you’re watching a small-cap token on a DEX. You notice a massive wallet swaps $250,000 USDC into the token via three separate transactions, spaced a few seconds apart. That’s not a random degen. That’s likely a coordinated entry. Even without an order book, you’ve just read real intention.
In short, while order flow analysis in traditional markets is all about the book and the tape, in crypto, it’s more fragmented — but also more transparent, if you know where to look.
Core Concepts Every Trader Should Understand
Before diving deeper into order flow tools, it’s essential to grasp the key dynamics that make the market tick. These are the building blocks that help you interpret what’s happening behind the charts in real time.
1. Market Orders vs. Limit Orders
Think of market orders as action — they execute instantly at the best price available. They’re aggressive, urgent, and they move the market. When someone slams a large market buy into the book, it eats through limit sell orders and pushes the price up.
Limit orders, on the other hand, are like setting traps. They wait. They don't move price — they absorb it. A pile of limit buy orders can act like support, while stacked sell orders may form resistance.
Practical takeaway: If you see an unusually large number of market buys punching through the ask and price still doesn't move much, something (or someone) is absorbing that demand. That’s worth paying attention to.
2. Bid-Ask Spread
The bid-ask spread is the difference between the highest price someone is willing to pay (bid) and the lowest price someone is willing to sell at (ask). A narrow spread suggests a liquid market with lots of participants. A wide spread? That’s thin liquidity, and it increases the chances of slippage.
You’ll often see wider spreads during volatile events or outside peak hours, especially in altcoin markets. In those moments, aggressive orders can cause sharp wicks up or down — not because of mass sentiment shifts, but simply because there was no liquidity to catch them.
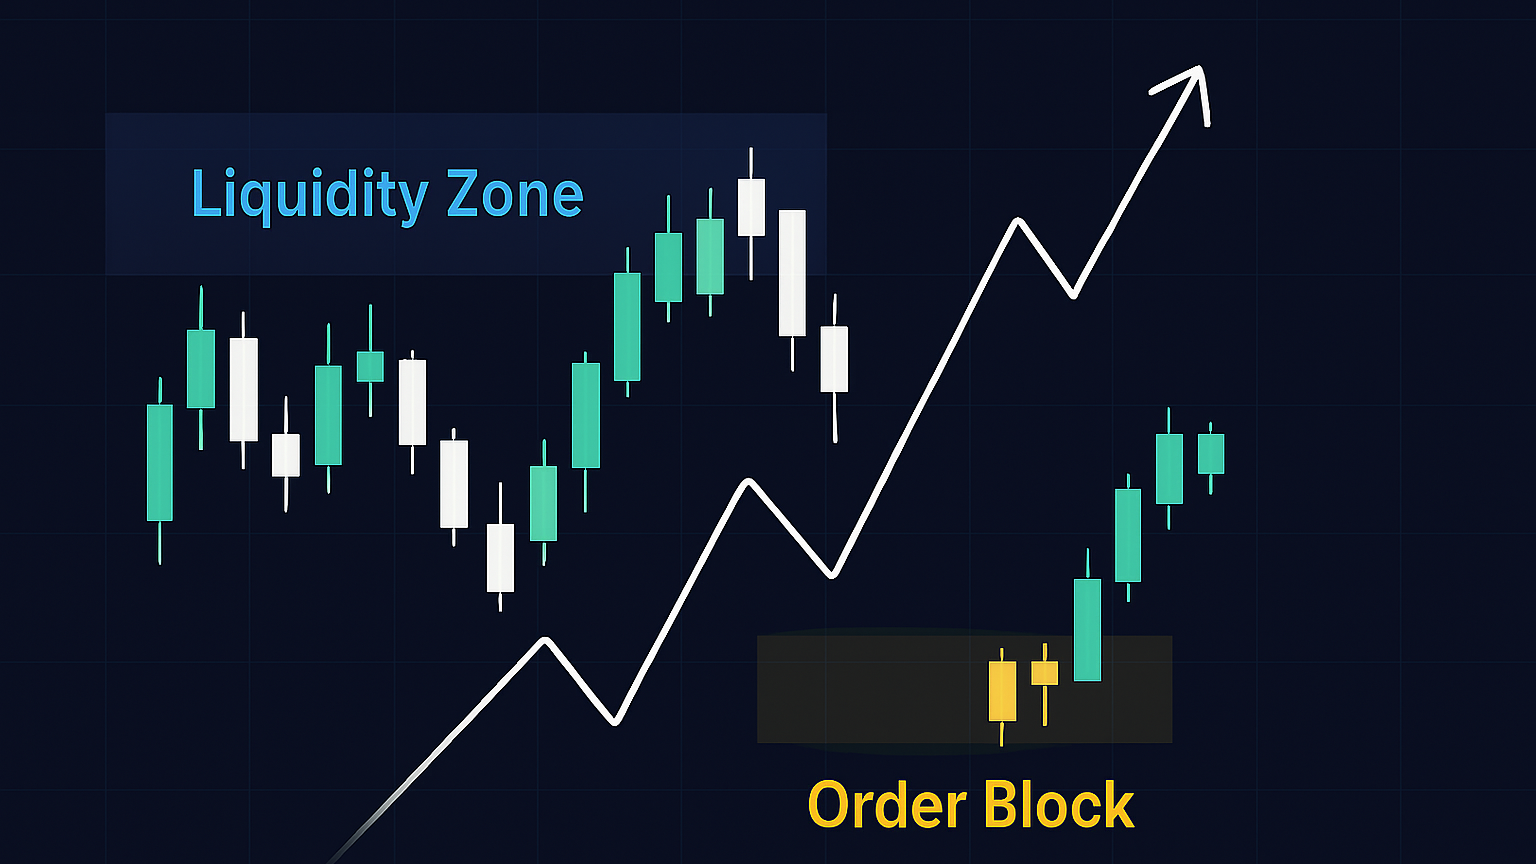
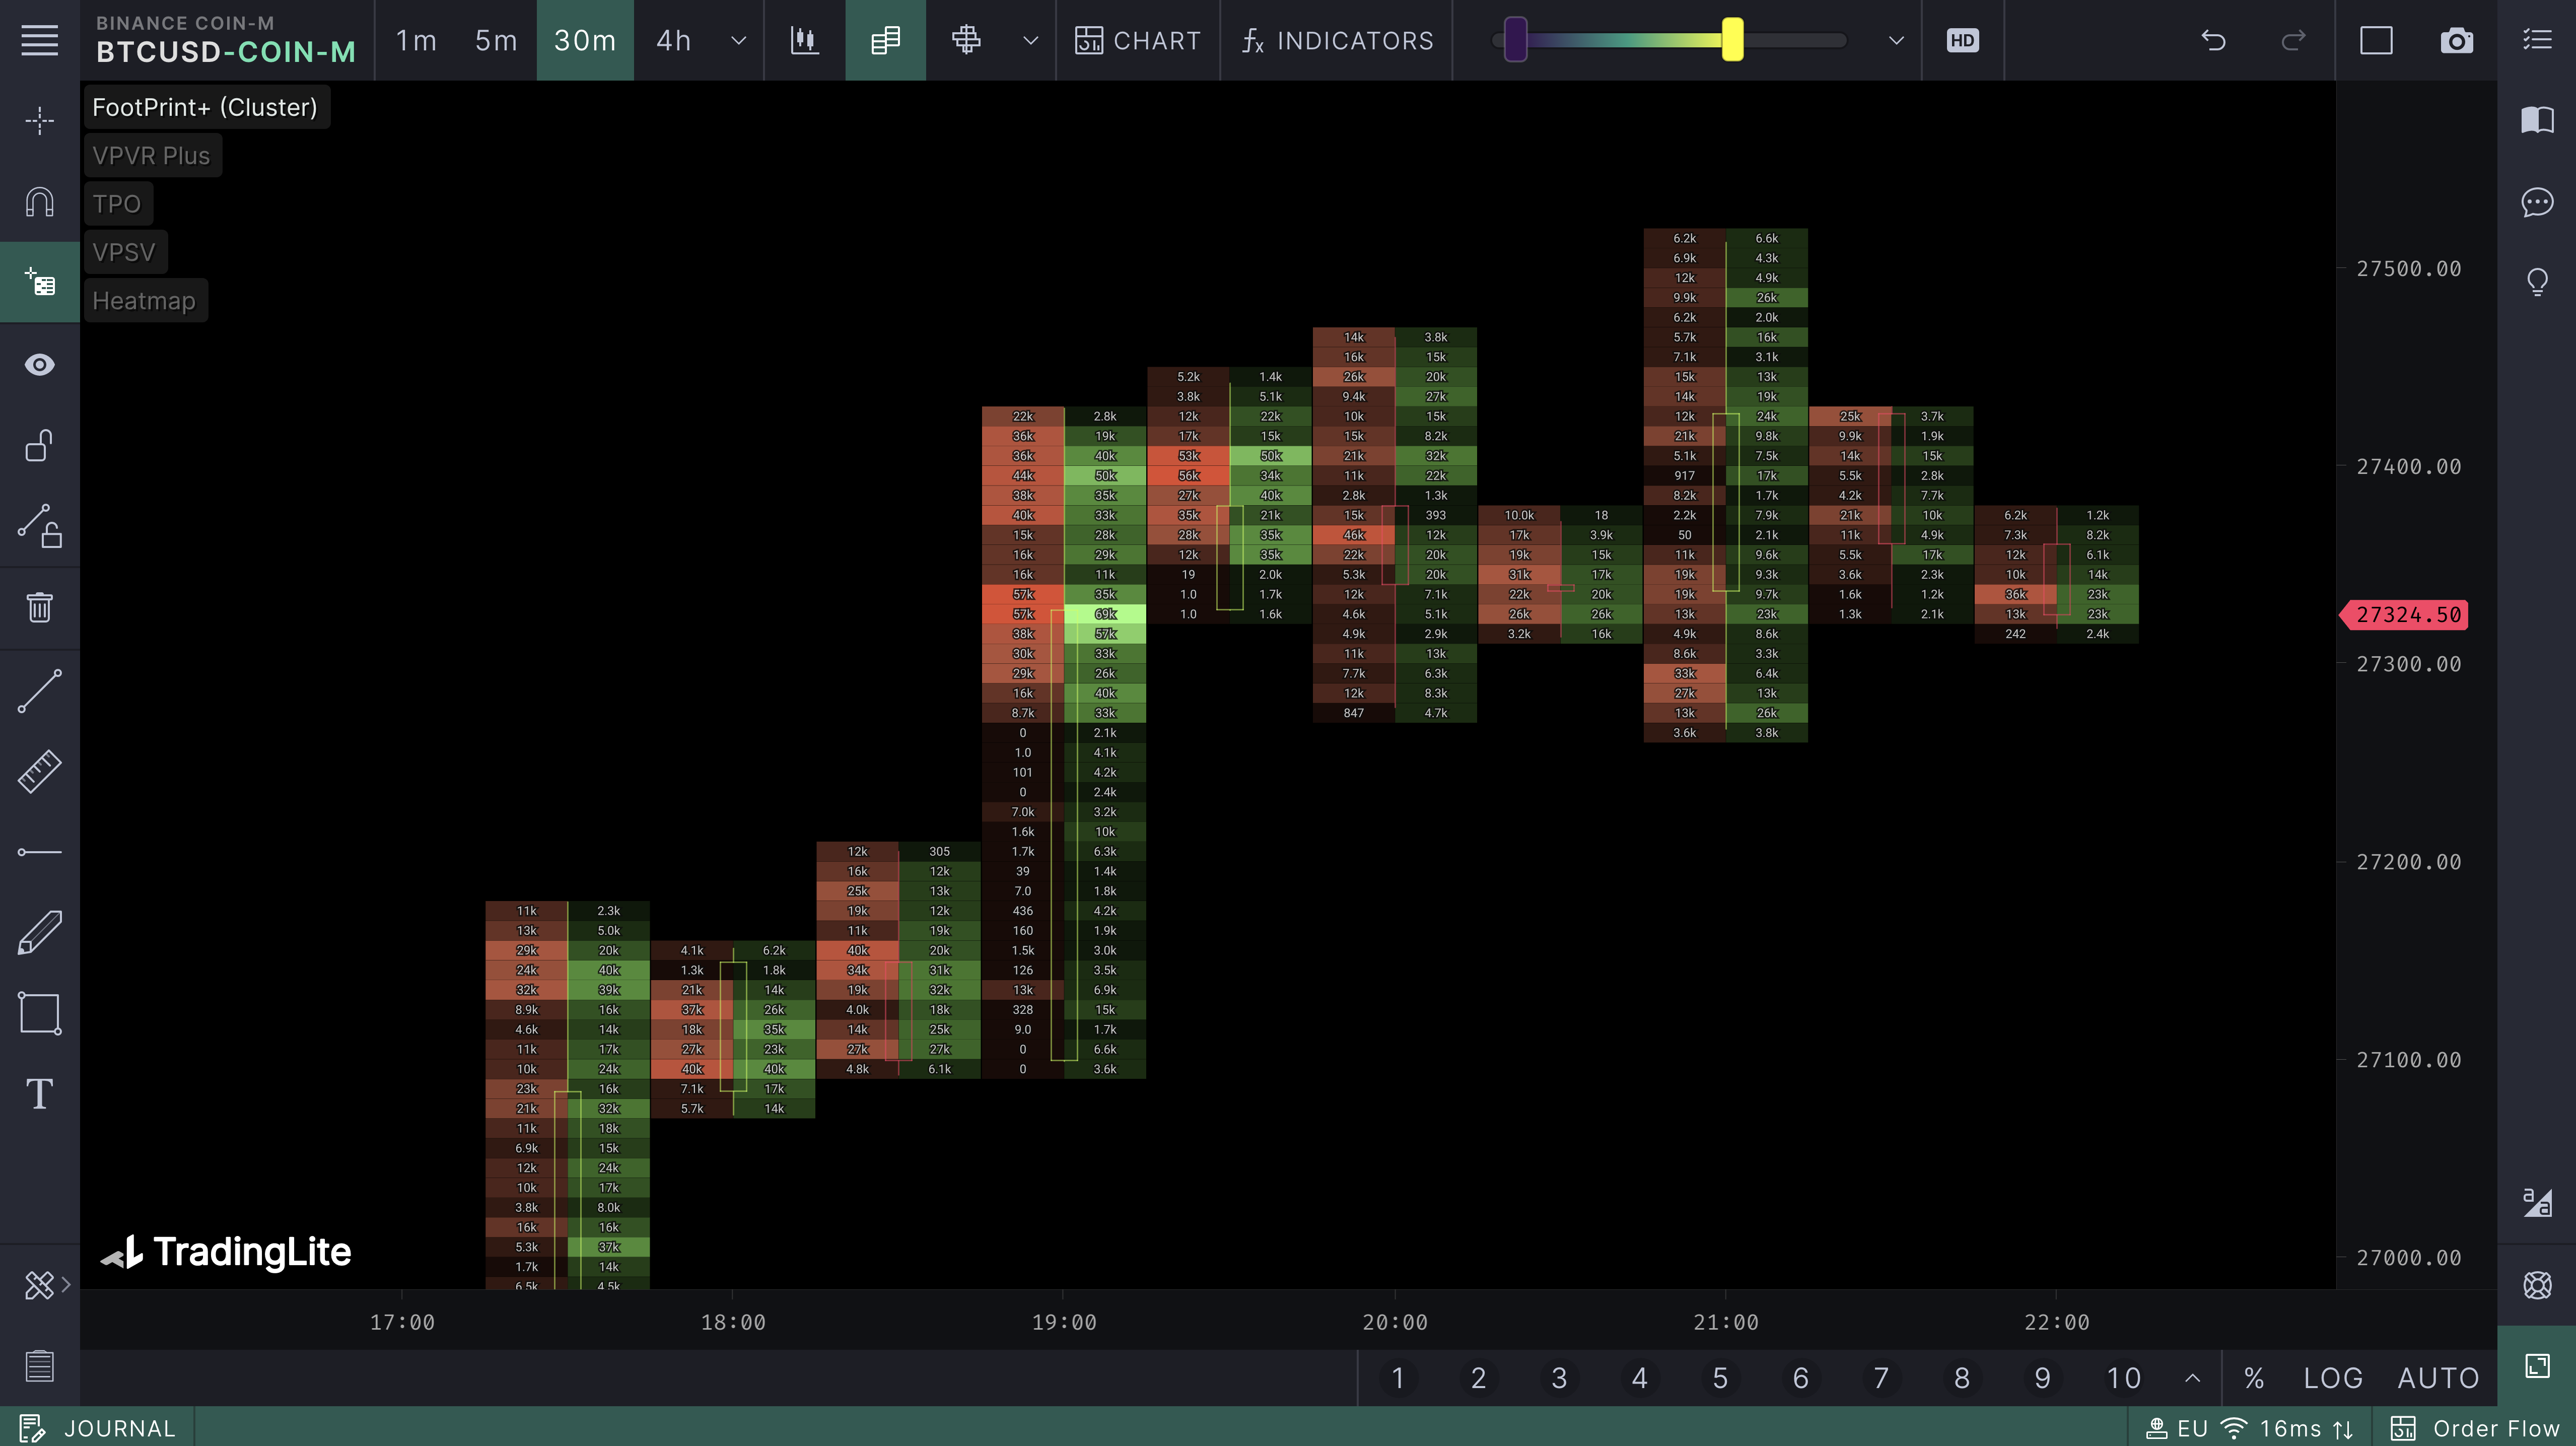
3. Liquidity Zones
Liquidity zones are areas on the chart where large volumes of limit orders are sitting. These act as magnets — price tends to gravitate toward them and either bounce or break.
Some traders look at heatmaps to visualize these zones (tools like TradingLite offer this). Others look at historical order book levels. In either case, knowing where liquidity sits can help you avoid getting caught in false breakouts or fading strong moves.
Relatable moment: Ever placed a short right as price tagged a “major resistance” level, only to see it blow past you? That resistance may have looked strong on the chart, but if there was no real sell-side liquidity, it wasn’t real resistance.
4. Order Book Imbalance
Order book imbalance occurs when there’s a noticeable skew between buy and sell orders. For example, if you see 3x more bids than asks at key levels, that suggests buyer dominance — at least in intent.
But be cautious: sometimes those large orders are fake (spoofing). They’re placed to influence sentiment, not to be filled. Watch to see if they get pulled as price nears them. If they disappear, you just witnessed deception in action.
Bottom line: Imbalance doesn’t guarantee movement, but when combined with tape speed and volume surges, it becomes a powerful confirmation tool.
How to Access Order Flow Data in Crypto
Understanding order flow is one thing. Accessing it — especially in crypto — is another.
Compared to traditional markets where data is centralized and standardized, crypto presents a unique challenge: data is scattered across centralized exchanges, decentralized protocols, and on-chain networks. Still, there are several effective ways to watch the flow if you know where to look.
1. Centralized Exchanges (CEXs)
Exchanges like Bybit, Binance, KuCoin, and Coinbase Advanced provide access to standard order flow tools such as:
- Order books – View resting bids and asks
- Depth charts – Visualize where clusters of liquidity exist
- Time & sales (tape) – Shows executed trades in real time
- DOM (Depth of Market) – For precision scalping, showing full order queue at each price level
Each platform differs slightly in execution speed, UI, and data refresh rates. Some exchanges aggregate trades or apply slight delays, so tape readers should always verify with live fills.
Example: On Bybit, if you see three consecutive 100k USDT buys executed at resistance, but the price doesn’t move — that’s information. Someone is selling aggressively into buyers. Either a big player is distributing, or a resistance level is being heavily defended.
2. Decentralized Exchanges (DEXs)
Decentralized platforms operate differently. Without order books, you won’t find traditional DOMs or tapes — but that doesn’t mean you’re flying blind.
On-chain tools can help you recreate order flow views:
- Etherscan / Solscan – Monitor wallet activity and high-value swaps in real time
- Dexscreener / GeckoTerminal – See recent transactions, wallet tags, and volume spikes
- Token Terminal / Nansen / Arkham – Follow smart money wallets and whale flows
While DEX data may lag by a few seconds compared to CEXs, it's radically transparent. You can inspect the actual wallet behind the transaction, see its history, and even watch MEV bots trying to front-run trades.
3. Hybrid Order Flow Tools
A few third-party platforms combine CEX and DEX data into a single stream. These include:
- Tensorcharts (for DOM and volume profiles)
- Bookmap (crypto beta) – Depth heatmaps and real-time visual tape
- Parsiq / Dune – Custom dashboards to track on-chain events and trade flows
These tools are more advanced but worth exploring if you want institutional-level visibility.
Takeaway: You don’t need Bloomberg Terminal-level access to start reading order flow in crypto. With a mix of CEX dashboards and DEX tracking tools, you can spot crowd behavior, hidden accumulation, and liquidity traps — all in real time.
Key Tools and Interfaces for Order Flow Analysis
Whether you're trading on a centralized exchange or monitoring decentralized flows, your edge comes from interpreting what is happening — not just that it's happening. To do that effectively, you'll need the right interfaces and tools that surface the hidden details in the market.
Here are some of the most useful:
1. Depth of Market (DOM)
DOM is a live feed of limit buy and sell orders at each price level. It shows how many contracts or tokens are waiting to be filled above and below the current market price.
- Why it matters: You can see when liquidity dries up, or when a price level is heavily stacked with limit orders.
- How it helps: DOM lets you spot walls of resistance/support, real or fake, before price even touches them.
Example: If you're watching KuCoin and see a 20,000-token sell wall that never gets hit — and then it disappears as price nears — that was likely a spoof. Someone wanted to intimidate buyers and slow the rally.
2. Time & Sales (Trade Tape)
This feed shows real-time completed trades — including size, direction (buy/sell), and time of execution. In short: this is the pulse of the market.
- What to watch: Large trades in rapid succession, sudden size spikes, or consistent tape prints at a key level.
- Pro tip: If the tape speeds up and the price doesn’t move, it may signal absorption — where large orders are being filled quietly.
3. Order Book Heatmaps
Heatmaps visualize order book liquidity by color and intensity. Bright colors indicate high concentration of orders. You can see whether liquidity is stacked just above or below the market, or if it’s pulling away during moves.
Popular tools include:
- TradingLite (CEX-focused)
- Tensorcharts (Bitcoin and crypto-specific)
- Bookmap (used by pro traders with crypto beta support)
4. On-Chain Order Flow Trackers
For DEX environments, traditional tools don’t apply — but you can still spot intent and flow via wallet activity.
Useful tools:
- Dexscreener / GeckoTerminal: Show recent trades, volumes, and liquidity shifts.
- Etherscan / Solscan: Track the timing and size of whale swaps or multi-tx activity.
- Arkham / Nansen: Surface wallet identities tied to institutions or known funds.
Example: A whale wallet on Ethereum splits a 7-figure swap into four transactions spaced a minute apart on Uniswap. The pattern may indicate stealth accumulation — and if repeated daily, it could signal a coordinated strategy.
5. Aggregators and Multi-Exchange Dashboards
If you're trading across Binance, Bybit, and Coinbase, it's useful to compare order flow side by side. Tools like DepthTrade, Parsiq, and custom Dune dashboards can aggregate data from multiple exchanges and on-chain feeds.
Bottom line: You don’t need every tool under the sun. Start with time & sales, order book depth, and a simple DEX scanner. Over time, layer in heatmaps, DOM, and on-chain signals to build a multi-angle view of the market in motion.
Reading the Tape: What to Look For
This is where order flow turns from data into instinct.
Reading the tape — that is, watching the stream of live transactions and order book behavior — helps you pick up on the micro-signals that precede big moves. It’s not about predicting the future. It’s about interpreting the present with greater precision than most traders.
Here are the key things to watch:
1. Speed of Execution
When the tape speeds up — meaning trades are printing faster — it signals rising urgency in the market.
- Fast tape + price rise = aggressive buying, often fueled by momentum or news.
- Fast tape + no price movement = someone is absorbing orders on the other side, potentially a whale or institution.
If you see rapid fire buys hitting resistance and price stalls, that could indicate a wall of sell-side liquidity absorbing everything — sometimes a precursor to a reversal.
2. Order Size and Clustering
Individual trade size matters. Small orders suggest retail flow. Large orders — especially if they cluster together — often point to whale activity or algorithmic execution.
What to watch for:
- Consistent large buys at the same price level = potential accumulation.
- Large sells that don’t move price = someone’s soaking them up quietly.
This kind of behavior can signal positioning that’s invisible on candles but obvious on the tape.

3. Iceberg Orders
These are large orders split into smaller visible chunks. A trader might be trying to buy 1,000 ETH without revealing their full hand. On the tape, you’ll see a series of similarly sized prints at the same price — over and over.
Tell-tale signs:
- Repeated small trades at a single price, often with little variation.
- The book never seems to “thin out” at that level.
Spotting an iceberg can help you ride the coattails of a big player instead of getting run over.
4. Spoofing and Fake Walls
Spoofing is when large limit orders appear in the book to manipulate sentiment, only to vanish before execution.
What it looks like:
- A massive sell wall appears at $2.00. Price approaches, but just before it gets hit, the wall disappears.
- Result: the market panics or hesitates — giving the spoofer time to fill smaller hidden buys lower.
While spoofing is illegal in regulated markets, it happens often in crypto. Learning to spot it can save you from bad entries — or help you anticipate a trap.
5. Absorption
Absorption happens when aggressive orders hit a price level repeatedly, but the level holds.
- If buyers slam into $26,000 five times and price barely budges, sellers are soaking it up.
- If sellers hammer the bid at $25,800 and it holds like a rock, someone’s accumulating.
This is often a sign that a big move is coming once one side exhausts.
Pro Tip: Watch how the market reacts to reactions. Does price accelerate when a wall breaks? Does it reject instantly after a spoof disappears? This meta-awareness separates tape watchers from tape readers.
Practical Takeaways + Use Case Examples
You now understand the components of order flow, how to read them, and what tools to use. But theory alone doesn’t make a trader. Let’s walk through a few simplified examples that show how order flow insights play out in real trading.

Example 1: Spotting Absorption Before a Breakout
Let’s say you’re watching ETH on Binance.
You notice a large sell wall at $3,000 — visible for the past hour. Price creeps up and starts hitting that wall with aggressive buy orders. You watch the tape, and see this:
- Buy 17.4 ETH @ $3,000
- Buy 23.1 ETH @ $3,000
- Buy 12.6 ETH @ $3,000
Yet the price doesn’t break through. Instead of rejecting, it keeps knocking — and the wall isn’t disappearing.
This is absorption. Someone is selling, but buyers keep stepping in and taking everything. After a few minutes, the sell wall clears — and the price quickly jumps to $3,050.
If you’d waited for the breakout candle, you’d be late. But by reading the tape and spotting the imbalance, you could’ve entered early, with a tighter stop.
Example 2: Avoiding a Fake Breakdown on a DEX
You’re tracking a low-cap token on Uniswap, using Dexscreener and Etherscan.
Price dips below recent support — a spot where many traders likely placed stop-losses. On the chart, it looks like a bearish breakdown. But on Etherscan, you notice three large wallets each buying into the dip with transactions over $50,000. No panic sells, just silent accumulation.
This is a classic stop-hunt followed by smart money entry.
The token bounces hard within 5 minutes. Traders who reacted to the chart got shaken out. You, on the other hand, read the on-chain flow and understood the real play.
Example 3: Recognizing a Spoofing Trap
On KuCoin, you’re watching the order book for a mid-cap altcoin.
A giant sell wall suddenly appears 1% above the current price. It intimidates buyers, price stagnates, and smaller sell orders start flooding in.
But you’re suspicious — the same wall appeared yesterday and vanished.
You watch the wall closely. As price approaches, it disappears — and seconds later, the tape shows several large market buys coming in. Price spikes upward.
This was spoofing. The seller never intended to hold that position. By staying patient and watching the tape, you avoided a trap — and possibly caught the breakout.
Three Actionable Tips
- Don’t watch everything — Focus on a small set of assets and get familiar with their typical flow.
- Start with time & sales — It’s easier to digest than DOM or heatmaps at first.
- Keep a log — Note moments when order flow signaled something meaningful. Over time, you’ll develop pattern recognition.
Order flow won’t tell you the future — but it will give you a front-row seat to what’s happening now, often before it shows up on the chart.
From Observing the Market to Understanding It
Most traders chase certainty. They want an indicator to flash green, a signal to shout “buy,” or a price level to act like magic. But order flow isn’t about certainty — it’s about context. It’s about seeing the market as a conversation, not a math problem.
The more time you spend watching the tape, the more fluently you begin to “read” it. You start to notice when something feels off — like when trades print but price stalls, or when a wall appears too perfect to be real. You recognize familiar behaviors: urgency, hesitation, aggression, manipulation.
It’s not about having an edge over everyone — just over the traders who rely solely on candles and indicators. By paying attention to order flow, you stop reacting to what happened, and start responding to what’s happening.
In decentralized markets, this takes extra work. It means digging into wallets, watching on-chain swaps, and tracking liquidity across fragmented protocols. But the reward is insight — raw, unfiltered information about what money is doing in real time.
Start small. Pick one asset. Watch the tape. Track a few wallets. Learn how it breathes.
Because once you can see the story behind the candles, you stop trading what the chart shows — and start trading what the market feels.
Comments
Log in to post a comment
No comments yet
Be the first to share your thoughts!
| Комиссии биржи | Методы внесения депозита | |||||||||
|---|---|---|---|---|---|---|---|---|---|---|
| Названия | Поддерживаемые криптовалюты | Комиссия тейкера | Комиссия мейкера | Комиссии за вывод средств | Банковский перевод | Кредитная карта | Trading API | АКТИВНЫЙ С | Offer | |
|
Bybit
Contract Trading Exchanges
|
188 | 0.06% | 0.01% | 0.0005 | 2018 |
GET UP TO USD 600 IN REWARDS!
|
Посетить | |||
|
Binance
Centralized Exchanges
|
433 | 0.10% | 0.10% | 0.0002 | 2017 |
GET UP TO USD 100 WELCOME BONUS
|
Посетить | |||
|
KuCoin
Centralized Exchanges
|
637 | 0.10% | 0.10% | 0.0005 | 2017 |
GET UP TO 500 USDT IN SIGN-UP BONUS
|
Посетить | |||
|
Coinbase
Centralized Exchanges
|
136 | 2.00% | 2.00% | 0.000079 | 2012 |
GET USD 5 SIGN-UP BONUS!
|
Посетить | |||
|
Uniswap
Decentralized Exchanges
|
390 | 0.30% | 0.30% | 0.000079 | 2018 |
|
||||
|
SushiSwap Exchange
Decentralized Exchanges
|
79 | 0.30% | 0.30% | 0.00041 | 2020 |
|
||||