
Fundamental vs. Technical Analysis in Crypto Investing June, 2026
Crypto investing can be chaotic — prices swing fast, and hype fades even faster. This guide breaks down Fundamental vs. Technical Analysis to help you choose better coins and time your trades smarter.
 Written by Nikolas Sargeant
| Taxas da Bolsa | Métodos de Depósito | |||||||||
|---|---|---|---|---|---|---|---|---|---|---|
| nome | Criptos Suportadas | Taxa de Tomador | Taxa de Autor | Taxas de Saque | Transferência Bancária | Cartão de Crédito | Trading API | ACTIVO DESDE | Offer | |
|
Bybit
Contract Trading Exchanges
|
188 | 0.06% | 0.01% | 0.0005 | 2018 |
RECEBA ATÉ US$600 EM RECOMPENSAS
|
Visita | |||
|
Binance
Centralized Exchanges
|
433 | 0.10% | 0.10% | 0.0002 | 2017 |
RECEBA ATÉ US$100 EM BÔNUS DE BOAS-VINDAS
|
Visita | |||
|
Kraken
Centralized Exchanges
|
125 | 0.26% | 0.16% | 0.0002 | 2011 |
GET USD 200 IN FEE CREDITS!
|
Visita | |||
|
KuCoin
Centralized Exchanges
|
637 | 0.10% | 0.10% | 0.0005 | 2017 |
RECEBA ATÉ 500 USDT EM BÔNUS DE CADASTRO
|
Visita | |||
The world of crypto investing moves fast. Prices swing by double digits in a single day, hype comes and goes, and trends can shift in the blink of an eye. For anyone stepping into this space, whether you’re investing in Bitcoin for the first time or trying to catch the next breakout altcoin, one question quickly becomes critical: How do you know what to buy… and when?
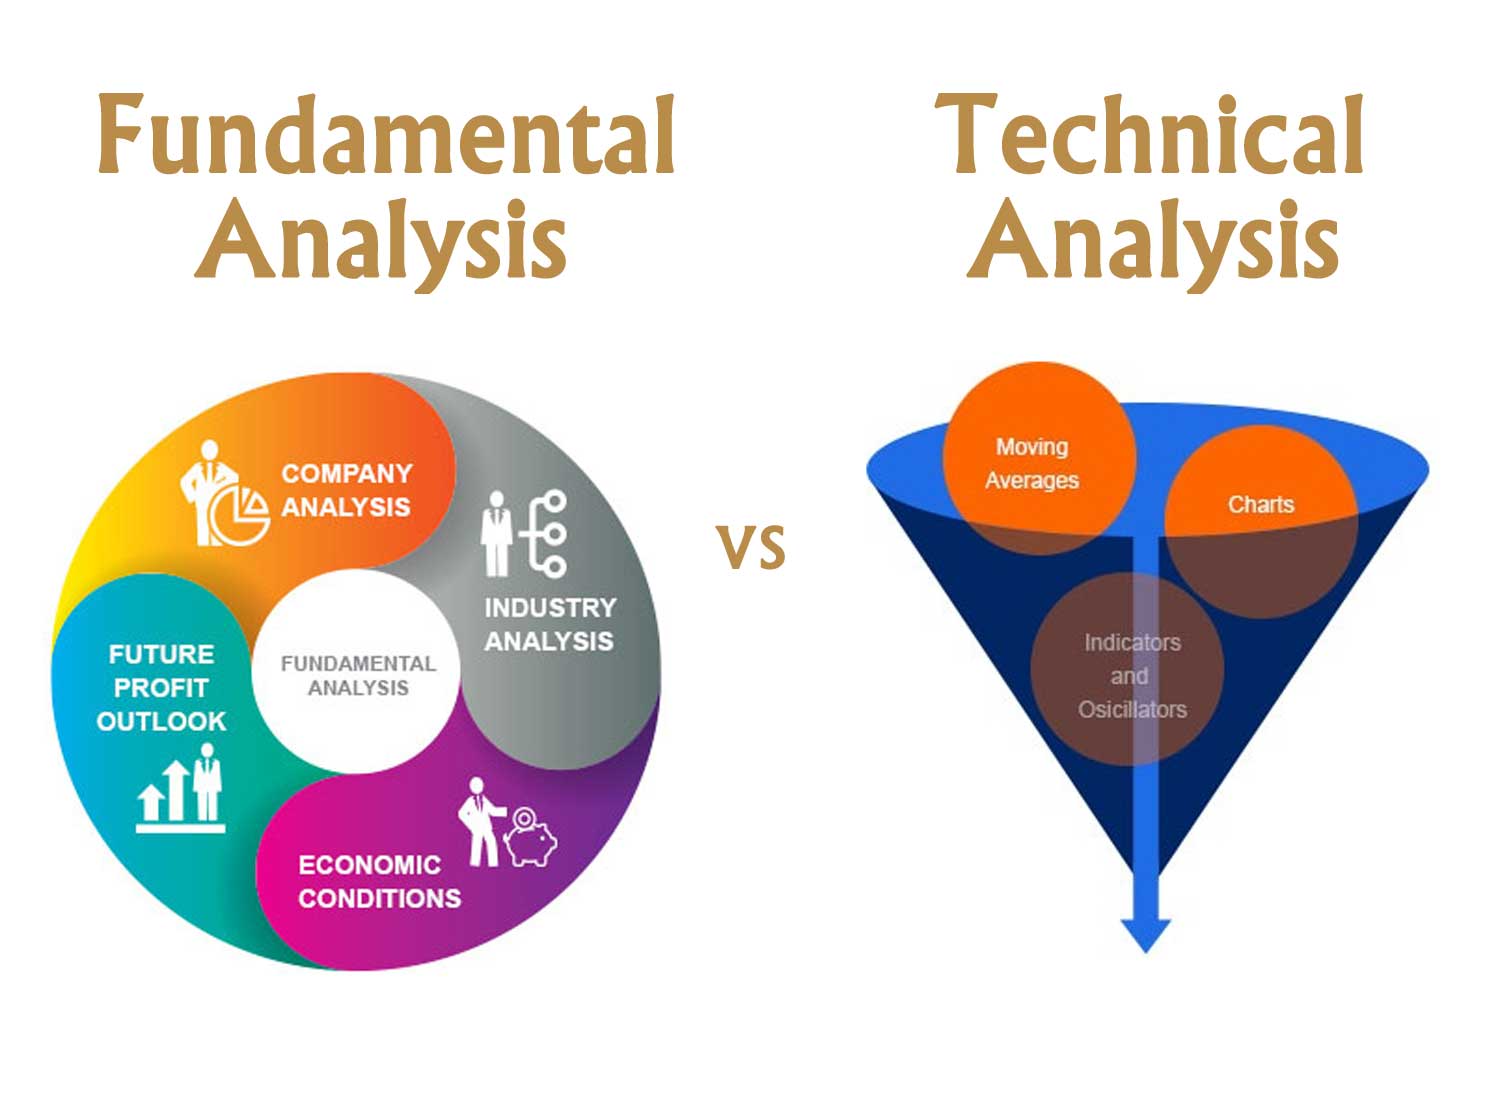
That’s where Fundamental Analysis (FA) and Technical Analysis (TA) come in. These are the two core strategies most successful investors and traders use to make sense of the chaos. While they approach the market from very different angles, they share a common goal: helping you make smarter, more confident decisions.
Fundamental Analysis is about understanding what a crypto project is worth by looking at its real-world value: the technology, the team, the use case, tokenomics, adoption, and more. It’s the method of the long-term investor who wants to find hidden gems early, before the rest of the market catches on.

Technical Analysis, on the other hand, doesn’t care what a coin does. It focuses on what the price is doing right now. It’s the preferred tool of short-term traders looking to identify entry and exit points using charts, indicators, and price action patterns.
In this guide, we’re going to break down both FA and TA in a way that’s clear, practical, and grounded in the real world of crypto. You’ll learn:
- What each strategy is and how it works
- When and why to use them
- Common tools and indicators
- Real success stories and costly failures
- How to combine both approaches into a powerful hybrid strategy
Whether you're building a long-term portfolio or learning to trade like a pro, understanding these two frameworks is essential. Let’s dive in.
What is Fundamental Analysis in Crypto?
In traditional finance, fundamental analysis (FA) is used to assess the “real” value of a stock based on business health, earnings, and growth potential. In crypto, it plays a similar role, but the metrics are very different.
In simple terms, FA helps you answer this question:
“Is this crypto project actually worth investing in?”
Rather than looking at charts and prices, you evaluate the underlying strength of the project, what it does, how it’s built, who’s behind it, and whether it has real-world traction.
Key Components of FA in Crypto
Here are the most important factors to consider when doing FA:
1. Whitepaper & Vision
The whitepaper is the blueprint. It should explain:
- What problem the project solves
- How the blockchain or token works
- The token’s role in the ecosystem
- The roadmap and long-term goals
Example: Ethereum’s original whitepaper laid the foundation for smart contracts, a concept now core to DeFi and NFTs.

2. Token Utility & Supply Mechanics
- What can the token actually be used for?
- Is it required for transactions, staking, governance, etc.?
- What’s the total and circulating supply? Inflationary or deflationary?
Example: BNB’s quarterly burn model reduces supply over time, supporting long-term value for holders.
3. Development Team & Activity
A strong, public-facing team with crypto experience is a good sign. Also:
- Is the GitHub active?
- Are updates regular?
- Are they responsive on Twitter or Discord?
Tool: CryptoMiso ranks projects by GitHub commits.
4. Adoption & Ecosystem Growth
- Are people using it?
- How many dApps, wallets, or integrations does it have?
- Are developers building on it?
Example: Solana saw explosive growth in late 2021 as DeFi and NFT projects launched on its ecosystem.
5. Partnerships & Backers
Who’s supporting this project?
- Are there VCs or notable partners?
- Strategic integrations or industry alliances?
Example: Chainlink’s partnership with SWIFT and dozens of DeFi apps boosted investor confidence.

6. Regulatory Risk
- Is the project compliant?
- Is it at risk of being classified as a security?
Example: Ripple (XRP) saw a massive drawdown when the SEC sued Ripple Labs.
When to Use FA
- Long-term investing: Ideal for building a portfolio of promising coins to hold 1–3+ years.
- IDO/ICO participation: Before buying new tokens, you should deeply analyze fundamentals.
- Bear markets: Great projects with strong fundamentals are often “on sale” when prices are low.
Real-World Success: Ethereum (ETH)
Investors who read Ethereum’s whitepaper in 2015 and understood the smart contract revolution could have bought ETH for under $1. By late 2021, it had hit $4,800+. That’s a 4,800x return, powered by sound fundamentals and a powerful network effect.
Failure Case: EOS
Despite raising over $4 billion in its ICO, EOS failed to gain traction. Why?
- Centralization issues
- Developer exodus
- Lack of innovation post-launch
Investors who relied on hype instead of true fundamentals were left with losses.

What is Technical Analysis in Crypto?
Technical Analysis (TA) is the practice of forecasting price movements by analyzing historical market data, mainly price, volume, and market behavior.
Unlike Fundamental Analysis, TA doesn’t care what a token does, who built it, or what problem it solves. It assumes all known information is already reflected in the current price.
TA helps answer:
“When should I enter or exit a trade to maximize profit (or minimize loss)?”
It’s used by day traders, swing traders, and scalpers to make short- to mid-term decisions, though long-term investors also use it to optimize buy/sell timing.
Core Tools of Technical Analysis
1. Candlestick Patterns
Each candlestick shows price action within a time frame (e.g., 1 hour, 1 day):
- Bullish reversal: Hammer, Morning Star
- Bearish reversal: Shooting Star, Evening Star
- Continuation: Doji, Spinning Top
Example: A Doji after a strong rally might signal upcoming weakness.
2. Support & Resistance Levels
These are price levels where buying or selling pressure has historically been strong.
- Support = “floor”
- Resistance = “ceiling”
Use case: Bitcoin often tests support at $30,000 and faces resistance around $38,000–$40,000.
3. Moving Averages (MA & EMA)
- Simple Moving Average (SMA): Averages closing prices over a period
- Exponential Moving Average (EMA): Weights recent prices more heavily
Example: Many traders consider BTC bullish when price is above the 200-day EMA.

4. Relative Strength Index (RSI)
Measures how “overbought” or “oversold” an asset is.
- Above 70 = overbought (possible pullback)
- Below 30 = oversold (possible bounce)
Example: In May 2021, RSI dropped below 30 for many altcoins — signaling a bounce opportunity.
5. MACD (Moving Average Convergence Divergence)
A momentum indicator using two EMAs:
- Bullish crossover = upward momentum
- Bearish crossover = downward pressure
6. Volume & Order Book Analysis
- Increasing volume during price moves confirms strength
- Weak volume may signal a fakeout
- Watching live order books can indicate pressure zones
Tool: Binance, Kraken, and KuCoin provide visual depth charts and real-time volume.

When to Use TA
- Short-term trading: Ideal for day/swing trades
- Entry/exit timing: Even long-term holders can improve entries using RSI or MA
- Breakouts: Detecting early momentum during trend changes
- Setting stop-losses: Protect capital by aligning stops with key levels
Real-World Success: Solana (SOL), 2021
In August 2021, SOL broke out of a consolidation pattern. Traders using TA (e.g., ascending triangle + high volume breakout) entered around $40–$50. It soared to over $200 in just weeks — a 4x gain.
Failure Case: Shiba Inu (SHIB), 2022
Some traders used bullish chart patterns to buy into SHIB at the top, ignoring:
- Massive token supply
- Meme hype cooling
- No real product use
TA couldn’t save them because price movements were driven by speculation — not technical structure.
Fundamental vs. Technical Analysis: Side-by-Side Comparison
While both Fundamental and Technical Analysis aim to improve your crypto investing decisions, they operate on entirely different principles. Here’s how they stack up:
|
Aspect |
Fundamental Analysis (FA) |
Technical Analysis (TA) |
|
Primary Focus |
Project quality and long-term value |
Price action and short-term movement |
|
Time Horizon |
Long-term (months to years) |
Short- to medium-term (minutes to weeks) |
|
Data Sources |
Whitepapers, team, tokenomics, community, partnerships |
Charts, volume, price history, indicators |
|
Use Case |
Value investing, identifying promising new projects |
Trading, identifying entry/exit points |
|
Tools & Platforms |
Messari, Token Terminal, CoinGecko, Discord, GitHub |
TradingView, Binance charts, RSI, MACD, Moving Averages |
|
Strengths |
Detects long-term winners early, protects against hype cycles |
Fast decisions, visual signals, good for active traders |
|
Weaknesses |
Slow signals, can’t time market well |
Can miss big-picture trends, vulnerable to manipulation/noise |
|
Best For |
Builders, long-term investors, early adopters |
Day traders, swing traders, timing-focused investors |
A Balanced Take
Both approaches are powerful, but incomplete on their own.
- Use FA to decide what to invest in.
- Use TA to decide when to buy or sell.
Smart investors often use a hybrid approach, and that’s exactly what we’ll break down in the next section.
Real-World Use Cases: Wins and Losses with FA & TA
Let’s bring theory into the real world. Below are real examples of how both Fundamental and Technical Analysis have helped crypto investors — and how ignoring either one has led to costly mistakes.
Success Stories: Using Fundamental Analysis
1. Ethereum (ETH) – Betting on the Smart Contract Revolution
In 2015, Ethereum launched with a clear value proposition: it wasn’t just digital money like Bitcoin — it was a decentralized platform for applications. Investors who read the whitepaper, understood the promise of smart contracts, and saw the developer activity, were making a fundamental bet on the future of programmable blockchains.
- Entry price: ~$0.75
- Peak price in 2021: ~$4,800
- Gain: Over 6,000x
- FA indicators: Whitepaper vision, Vitalik’s leadership, early dApp ecosystem
2. Polygon (MATIC) – Scaling Ethereum Before It Was Cool
Polygon positioned itself early as an Ethereum scaling solution. It wasn’t sexy at first — but smart FA revealed:
- Consistent GitHub activity
- Real-world integrations (Aave, Uniswap)
- Aggressive developer grants
Investors who saw the ecosystem growth and long-term utility made 50x+ returns from 2020 to late 2021.
Success Stories: Using Technical Analysis
3. Solana (SOL) – The Breakout Pattern That Paid
In August 2021, SOL was trading sideways after a strong run. Technical traders noticed:
- Ascending triangle pattern on daily chart
- Increasing volume on breakout
- RSI not yet overbought
This setup screamed “bullish continuation.” Price surged from $40 to $200+ in a matter of weeks.
4. Bitcoin (BTC) – RSI and Moving Averages During Cycles
During the 2020–2021 bull run:
- Bitcoin bounced repeatedly off the 200-day EMA
- RSI dips below 40 often signaled local bottoms
- Price respected long-term trendlines
Traders who understood these indicators booked solid profits or avoided panic-selling.
Failure Stories: Blind Faith in Fundamentals
5. EOS – $4 Billion Hype, $0 Delivery
EOS raised a record $4B in its ICO. It promised high throughput and a “developer paradise.” But post-launch:
- Community declined
- Governance concerns emerged
- Little meaningful adoption followed
Despite the huge raise and a technically impressive whitepaper, EOS became a cautionary tale: money raised ≠ fundamentals.
6. Terra (LUNA/UST) – A Design Flaw Hidden Beneath the Hype
UST was a stablecoin designed to keep value via an algorithm tied to LUNA. Many saw strong FA signals:
- Big ecosystem (Anchor Protocol, Mirror)
- Top 10 token by market cap
- Dev activity + partnerships
But the core mechanism was flawed. Once UST de-pegged in May 2022, the system collapsed—wiping out $60B+ in value.
Failure Stories: Overreliance on Technicals
7. Shiba Inu (SHIB) – TA vs. Meme Hype
In late 2021, SHIB had strong momentum. TA showed:
- Bull flags
- RSI cooling off
- High volume spikes
But traders ignoring the token supply (trillions) and influencer-driven volatility got wrecked. SHIB lost 70%+ in weeks. This was a reminder: TA can’t measure hype decay.

8. Micro-cap DeFi Tokens – False Breakouts
Many small DeFi projects in 2020–21 had textbook bullish setups:
- Breakouts
- High volume
- RSI signals
But low liquidity made these moves unreliable. Smart traders learned: TA without FA = gambling, especially in altcoins.
How to Use Both: Combining FA & TA in Crypto
The smartest crypto investors don’t pick sides between Fundamental and Technical Analysis — they use both.
Think of it like this:
- FA tells you what to buy.
- TA tells you when to buy it.
By blending the two, you can find high-potential projects and time your entries (and exits) for maximum impact. It’s the difference between buying a rocket… and launching it at the right moment.
Why Use a Hybrid Approach?
Crypto is unique in that it blends venture investing (like betting on startups) with public market trading (like playing the stock market). That’s why neither FA nor TA alone is enough:
- FA helps you avoid bad projects, rugs, or dead protocols
- TA helps you avoid poor timing, buying tops, or selling bottoms
- Together, they offer conviction + timing
Real-World Example: Arbitrum (ARB)
Let’s say you’re analyzing Arbitrum in 2024:
Fundamentals:
- Leading Ethereum L2 for scaling
- High TVL (Total Value Locked)
- Growing number of dApps
- Tokenomics: Unlock schedule visible, no surprise dumps
Technical Analysis:
- RSI at 28 (oversold)
- Strong support at $1.10
- MACD crossover suggests upward momentum
- Volume spike on bounce
Result: You decide to enter around $1.10 with a stop-loss at $0.99 and a target at $1.60. FA gives confidence, TA gives timing.
Case Study: Avalanche (AVAX), 2021
FA Indicators:
- Unique consensus model
- Incentives via Avalanche Rush
- Rapid dApp growth + DeFi expansion
TA Indicators:
- Breakout from long consolidation
- RSI confirmed bullish momentum
- Volume supported the move
Outcome? AVAX ran from $15 → $140 in just 3 months.
When to Use the Hybrid Model
- Buying dips: Use FA to verify quality, TA to find support levels
- Swing trades: Pick strong projects only, use TA to enter on trend reversals
- Avoiding FOMO: FA may say “yes,” but TA may say “not yet”
Common Pitfalls to Avoid in Crypto Analysis
Even with solid knowledge of FA and TA, many investors still lose money — not because the tools failed, but because they misused them.
Let’s look at the most common mistakes you should avoid:
Fundamental Analysis Mistakes
1. Overhyping Whitepapers
Just because a whitepaper sounds impressive doesn’t mean the project will deliver. Many rug pulls and dead projects had polished documents but no real execution.
Tip: Always verify whitepaper claims with real product development and GitHub activity.

2. Ignoring Token Unlock Schedules
Many projects release large amounts of tokens months after launch, crashing prices.
Example: Aptos (APT) faced a price dip when early investors' tokens unlocked. Always check tokenomics and vesting cliffs.
3. Assuming Partnerships = Success
Just because a project “partners” with a major brand doesn’t mean it has deep integration or real impact.
Tip: Look for active collaborations, not just name-drops.
Technical Analysis Mistakes
4. Overfitting Indicators
Relying on too many indicators can lead to “analysis paralysis.” Indicators often conflict — don’t wait for 10 green lights.
Fix: Use 2–3 core indicators that match your strategy.
5. Ignoring Volume and Liquidity
In low-volume markets, TA patterns often break down. A perfect chart setup is meaningless if there’s not enough liquidity to support it.
Fix: Check volume before entering — especially on DEX-traded altcoins.

6. No Risk Management
Even the best TA setups fail. If you don’t use stop-losses or position sizing, one loss can wipe you out.
Fix: Set clear risk parameters. Never risk more than 1–2% of your capital on a single trade.
Tools & Resources for Crypto FA & TA
Whether you lean toward fundamentals or prefer reading charts, the right tools make all the difference. Below is a curated list of trusted, widely used platforms to power your research and trading.
Top Tools for Fundamental Analysis
Messari
A professional-grade platform offering in-depth research, tokenomics, project overviews, and on-chain metrics. Great for FA deep dives.
→ messari.io
Token Terminal
Focuses on financial data for crypto projects — revenue, users, developer activity — like a Bloomberg terminal for Web3.
→ tokenterminal.com
CoinGecko & CoinMarketCap
Get token supply data, market caps, contract addresses, and launch info. CoinGecko is slightly more decentralized.
→ coingecko.com | coinmarketcap.com
Dune Analytics
User-generated dashboards tracking everything from NFT mint stats to L2 adoption. Great for on-chain fundamentals.
→ dune.xyz
GitHub Activity
Check if a team is shipping code. Tools like CryptoMiso and Santiment visualize developer activity.

Top Tools for Technical Analysis
TradingView
The go-to charting platform for crypto (and traditional markets). Offers every TA indicator, plus scripting and social charts.
→ tradingview.com
Glassnode & CryptoQuant
Blend TA and on-chain data: see wallet flows, exchange deposits, miner activity, and more.
→ glassnode.com | cryptoquant.com
Coinalyze
Provides real-time indicators, funding rates, open interest, and volume data — especially useful for futures traders.
→ coinalyze.net
Binance, Bybit, KuCoin
Their native apps/charts include heatmaps, live order books, and depth charts. Helpful for spotting real-time momentum shifts.
Conclusion: Mastering the Balance Between FA and TA
Crypto investing isn’t about certainty — it’s about increasing your probability of success. And that’s exactly what Fundamental Analysis and Technical Analysis are designed to do.
- FA helps you identify strong projects with real utility, solid teams, and long-term value.
- TA helps you navigate volatile price swings and find ideal entry and exit points.
You don’t have to choose one or the other. In fact, most successful crypto investors combine both:
- They research what to invest in using FA…
- …and use TA to decide when to act.
This hybrid approach is how you avoid hype traps, time the market better, and build long-term conviction. Whether you're building a portfolio of altcoins or actively trading BTC/ETH on the daily, this mindset gives you a massive edge.
As always, continue learning, test strategies for yourself, and stay humble — the crypto market rewards those who do their homework.
Comments
Log in to post a comment
No comments yet
Be the first to share your thoughts!
| Taxas da Bolsa | Métodos de Depósito | |||||||||
|---|---|---|---|---|---|---|---|---|---|---|
| nome | Criptos Suportadas | Taxa de Tomador | Taxa de Autor | Taxas de Saque | Transferência Bancária | Cartão de Crédito | Trading API | ACTIVO DESDE | Offer | |
|
Bybit
Contract Trading Exchanges
|
188 | 0.06% | 0.01% | 0.0005 | 2018 |
RECEBA ATÉ US$600 EM RECOMPENSAS
|
Visita | |||
|
Binance
Centralized Exchanges
|
433 | 0.10% | 0.10% | 0.0002 | 2017 |
RECEBA ATÉ US$100 EM BÔNUS DE BOAS-VINDAS
|
Visita | |||
|
Kraken
Centralized Exchanges
|
125 | 0.26% | 0.16% | 0.0002 | 2011 |
GET USD 200 IN FEE CREDITS!
|
Visita | |||
|
KuCoin
Centralized Exchanges
|
637 | 0.10% | 0.10% | 0.0005 | 2017 |
RECEBA ATÉ 500 USDT EM BÔNUS DE CADASTRO
|
Visita | |||