


 Hassan Maishera

TL;DR
-
Shiba Inu gained more than 10% on Monday and extended its advance on Tuesday, trading near $0.0000062.
-
Santiment data shows SHIB trading volume rose from 74.69 million on Sunday to 210.90 million on Tuesday.
-
Open interest reached 12.93 trillion SHIB, while the funding rate stood at a positive 0.0099%.
-
A daily close above the descending trendline near $0.0000063 could bring $0.0000068 into focus; support sits near $0.0000056.
Shiba Inu (SHIB) extended its rally on Tuesday, trading above $0.0000060 after gaining more than 10% the previous day.
The meme coin was up nearly 3% on Tuesday and trading around $0.0000062 in the source analysis, putting it close to a descending trendline that has limited previous advances.
Several measures of market activity have strengthened alongside the price. Trading volume has risen sharply since Sunday, outstanding futures contracts have increased, and funding rates have turned positive.
On the daily chart, SHIB has also moved back above its 200-day exponential moving average.
Those signals point to stronger participation in the rally. They do not settle whether buyers can carry SHIB beyond its next resistance level.
A close above the trendline near $0.0000063 would provide a clearer technical signal, while a rejection could prompt traders to reassess the recent gains.
SHIB Trading Volume Climbs as Price Recovers
Santiment data cited in the original analysis shows Shiba Inu trading volume rose from 74.69 million on Sunday to 210.90 million on Tuesday. That puts activity on a path toward levels last seen on August 21.
The increase matters because it shows the price advance has attracted substantially more trading. SHIB’s double-digit rise on Monday was followed by further gains on Tuesday, suggesting the move did not end with a single burst of activity.
Volume alone cannot reveal whether buyers will remain in control. Every trade has both a buyer and a seller, and a surge in turnover may include profit-taking as well as fresh purchases.
Still, rising volume during an advance shows that more participants are engaging with the market. Traders will be watching whether that activity remains elevated if SHIB reaches the descending trendline.
If volume stays strong through a break above resistance, the move may have more support than a brief price spike on thin trading. If activity fades as SHIB approaches $0.0000063, the market could struggle to sustain the breakout.
Shiba Inu’s derivatives market has also become more active. CoinGlass data shows open interest has climbed since mid-September, reaching 12.93 trillion SHIB in outstanding contracts on Tuesday.
Open interest measures contracts that remain open, so an increase indicates that traders are adding exposure rather than simply closing existing positions.
The rise in open interest alongside SHIB’s price and trading volume is consistent with growing confidence in the move.
It does not prove that every new position is a long: futures contracts have traders on both sides. The funding rate provides a separate indication of how those positions are priced.
SHIB’s funding rate turned positive on September 16 and stood at 0.0099% on Tuesday, according to CoinGlass.
A positive rate means traders holding long perpetual futures positions are paying those holding shorts. It generally indicates that demand for long exposure has strengthened.
Together, rising open interest and positive funding suggest that traders are committing more capital while favoring further gains. They can also make the market more sensitive to a reversal.
If the price falls unexpectedly, leveraged positions may be closed quickly, adding pressure to the decline. Continued gains would be more convincing if SHIB can hold higher price levels without relying solely on an expanding futures market.
SHIB Reclaims Its 200-Day Moving Average
The daily chart has improved following Monday’s rally. SHIB closed above its 200-day exponential moving average, located near $0.0000056 in the source analysis, and extended the move on Tuesday.
Traders often use the 200-day average to assess the broader direction of a price trend. Moving above it does not guarantee a sustained advance, but it places SHIB on stronger technical footing than it had while trading below the indicator. The average also becomes an important level to monitor if the price pulls back.
Momentum indicators currently favor buyers. The Moving Average Convergence Divergence indicator, or MACD, made a bullish crossover on Saturday. Its positive histogram bars have continued to rise, indicating that upward momentum has strengthened.
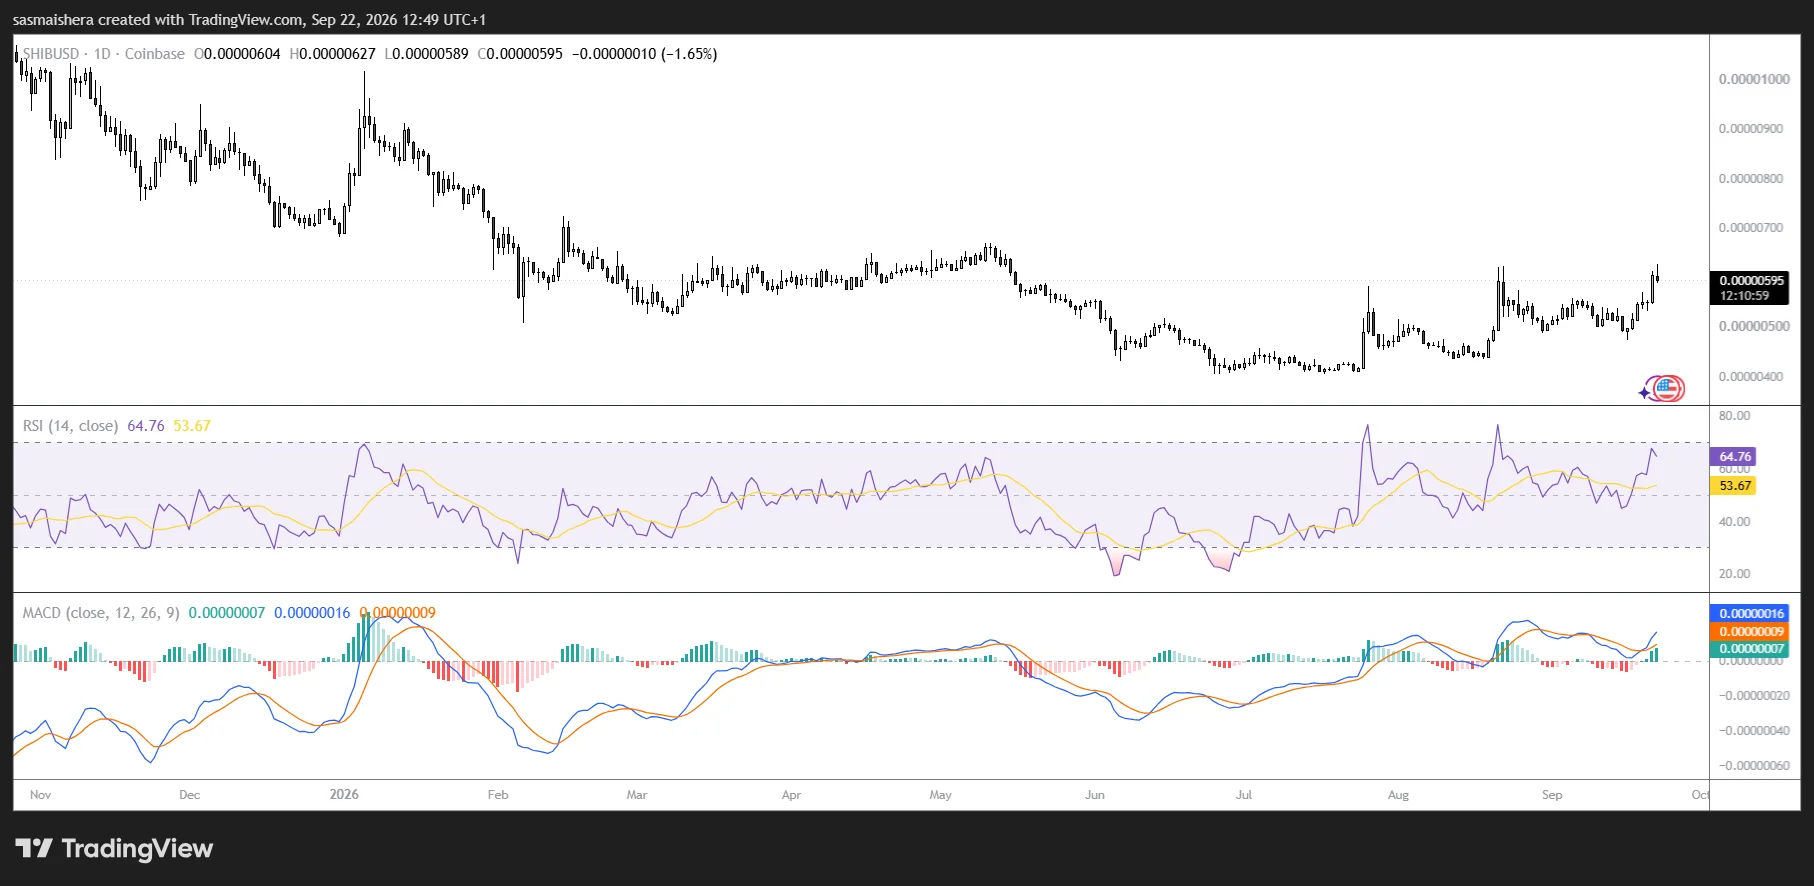
The Relative Strength Index is also moving toward 70, the level commonly used to mark overbought conditions. Its rise reflects the strength of SHIB’s recent advance. As the indicator approaches that threshold, traders may also become more alert to a pause or a period of profit-taking after the rapid rally.
The technical picture therefore depends on what happens at the next resistance test. Momentum is improving, but SHIB has not yet confirmed a break above the descending trendline identified in the original analysis.
Shiba Inu Price Outlook: $0.0000063 Is the Next Test
SHIB was trading around $0.0000062 on Tuesday, just below the descending trendline near $0.0000063. A daily close above that zone would signal that buyers have overcome a barrier that previously capped the price. If the breakout holds, the next resistance level cited in the source analysis is around $0.0000068.
A brief move through $0.0000063 would offer less confirmation than a close above it followed by sustained trading at higher levels. Traders will also be watching volume and open interest for signs that participation continues after the initial break.
If SHIB turns lower instead, the 200-day EMA near $0.0000056 is the main support level identified in the analysis. A pullback toward that average would test whether buyers are willing to defend the price area reclaimed on Monday.
For now, rising volume, greater futures participation, and positive daily-chart momentum support SHIB’s recovery. The clearest next signal will come from its response to $0.0000063: a sustained break would favor a test of $0.0000068, while failure there would leave the recent rally vulnerable to a retracement.